Albanian College, Under 1 year

COMPARE

Albanian
Race
Ancestry
AfghanAfricanAlaska NativeAlaskan AthabascanAlbanianAleutAlsatianAmericanApacheArabArapahoArgentineanArmenianAssyrian/Chaldean/SyriacAustralianAustrianBahamianBangladeshiBarbadianBasqueBelgianBelizeanBermudanBhutaneseBlackfeetBolivianBrazilianBritishBritish West IndianBulgarianBurmeseCajunCambodianCanadianCape VerdeanCarpatho RusynCelticCentral AmericanCentral American IndianCherokeeCheyenneChickasawChileanChineseChippewaChoctawColombianColvilleComancheCosta RicanCreeCreekCroatianCrowCubanCypriotCzechCzechoslovakianDanishDelawareDominicanDutchDutch West IndianEastern EuropeanEcuadorianEgyptianEnglishEstonianEthiopianEuropeanFijianFilipinoFinnishFrenchFrench American IndianFrench CanadianGermanGerman RussianGhanaianGreekGuamanian/ChamorroGuatemalanGuyaneseHaitianHmongHonduranHopiHoumaHungarianIcelanderIndian (Asian)IndonesianInupiatIranianIraqiIrishIroquoisIsraeliItalianJamaicanJapaneseJordanianKenyanKiowaKoreanLaotianLatvianLebaneseLiberianLithuanianLumbeeLuxembourgerMacedonianMalaysianMalteseMarshalleseMenomineeMexicanMexican American IndianMongolianMoroccanNative HawaiianNavajoNepaleseNew ZealanderNicaraguanNigerianNorthern EuropeanNorwegianOkinawanOsageOttawaPaiutePakistaniPalestinianPanamanianParaguayanPennsylvania GermanPeruvianPimaPolishPortuguesePotawatomiPuebloPuerto RicanPuget Sound SalishRomanianRussianSalvadoranSamoanScandinavianScotch-IrishScottishSeminoleSenegaleseSerbianShoshoneSierra LeoneanSiouxSlavicSlovakSloveneSomaliSouth AfricanSouth AmericanSouth American IndianSoviet UnionSpaniardSpanishSpanish AmericanSpanish American IndianSri LankanSubsaharan AfricanSudaneseSwedishSwissSyrianTaiwaneseThaiTlingit-HaidaTohono O'OdhamTonganTrinidadian and TobagonianTsimshianTurkishU.S. Virgin IslanderUgandanUkrainianUruguayanUteVenezuelanVietnameseWelshWest IndianYakamaYaquiYugoslavianYumanYup'ikZimbabwean
Immigration
NonimmigrantsImmigrantsAfghanistanAfricaAlbaniaArgentinaArmeniaAsiaAustraliaAustriaBahamasBangladeshBarbadosBelarusBelgiumBelizeBoliviaBosnia and HerzegovinaBrazilBulgariaBurma/MyanmarCabo VerdeCambodiaCameroonCanadaCaribbeanCentral AmericaChileChinaColombiaCongoCosta RicaCroatiaCubaCzechoslovakiaDenmarkDominicaDominican RepublicEastern AfricaEastern AsiaEastern EuropeEcuadorEgyptEl SalvadorEnglandEritreaEthiopiaEuropeFijiFranceGermanyGhanaGreeceGrenadaGuatemalaGuyanaHaitiHondurasHong KongHungaryIndiaIndonesiaIranIraqIrelandIsraelItalyJamaicaJapanJordanKazakhstanKenyaKoreaKuwaitLaosLatin AmericaLatviaLebanonLiberiaLithuaniaMalaysiaMexicoMicronesiaMiddle AfricaMoldovaMoroccoNepalNetherlandsNicaraguaNigeriaNorth AmericaNorth MacedoniaNorthern AfricaNorthern EuropeNorwayOceaniaPakistanPanamaPeruPhilippinesPolandPortugalRomaniaRussiaSaudi ArabiaScotlandSenegalSerbiaSierra LeoneSingaporeSomaliaSouth AfricaSouth AmericaSouth Central AsiaSouth Eastern AsiaSouthern EuropeSpainSri LankaSt. Vincent and the GrenadinesSudanSwedenSwitzerlandSyriaTaiwanThailandTrinidad and TobagoTurkeyUgandaUkraineUruguayUzbekistanVenezuelaVietnamWest IndiesWestern AfricaWestern AsiaWestern EuropeYemenZaireZimbabweAzores
Select to Compare
Race
Ancestry
AfghanAfricanAlaska NativeAlaskan AthabascanAleutAlsatianAmericanApacheArabArapahoArgentineanArmenianAssyrian/Chaldean/SyriacAustralianAustrianBahamianBangladeshiBarbadianBasqueBelgianBelizeanBermudanBhutaneseBlackfeetBolivianBrazilianBritishBritish West IndianBulgarianBurmeseCajunCambodianCanadianCape VerdeanCarpatho RusynCelticCentral AmericanCentral American IndianCherokeeCheyenneChickasawChileanChineseChippewaChoctawColombianColvilleComancheCosta RicanCreeCreekCroatianCrowCubanCypriotCzechCzechoslovakianDanishDelawareDominicanDutchDutch West IndianEastern EuropeanEcuadorianEgyptianEnglishEstonianEthiopianEuropeanFijianFilipinoFinnishFrenchFrench American IndianFrench CanadianGermanGerman RussianGhanaianGreekGuamanian/ChamorroGuatemalanGuyaneseHaitianHmongHonduranHopiHoumaHungarianIcelanderIndian (Asian)IndonesianInupiatIranianIraqiIrishIroquoisIsraeliItalianJamaicanJapaneseJordanianKenyanKiowaKoreanLaotianLatvianLebaneseLiberianLithuanianLumbeeLuxembourgerMacedonianMalaysianMalteseMarshalleseMenomineeMexicanMexican American IndianMongolianMoroccanNative HawaiianNavajoNepaleseNew ZealanderNicaraguanNigerianNorthern EuropeanNorwegianOkinawanOsageOttawaPaiutePakistaniPalestinianPanamanianParaguayanPennsylvania GermanPeruvianPimaPolishPortuguesePotawatomiPuebloPuerto RicanPuget Sound SalishRomanianRussianSalvadoranSamoanScandinavianScotch-IrishScottishSeminoleSenegaleseSerbianShoshoneSierra LeoneanSiouxSlavicSlovakSloveneSomaliSouth AfricanSouth AmericanSouth American IndianSoviet UnionSpaniardSpanishSpanish AmericanSpanish American IndianSri LankanSubsaharan AfricanSudaneseSwedishSwissSyrianTaiwaneseThaiTlingit-HaidaTohono O'OdhamTonganTrinidadian and TobagonianTsimshianTurkishU.S. Virgin IslanderUgandanUkrainianUruguayanUteVenezuelanVietnameseWelshWest IndianYakamaYaquiYugoslavianYumanYup'ikZimbabwean
Immigration
NonimmigrantsImmigrantsAfghanistanAfricaAlbaniaArgentinaArmeniaAsiaAustraliaAustriaBahamasBangladeshBarbadosBelarusBelgiumBelizeBoliviaBosnia and HerzegovinaBrazilBulgariaBurma/MyanmarCabo VerdeCambodiaCameroonCanadaCaribbeanCentral AmericaChileChinaColombiaCongoCosta RicaCroatiaCubaCzechoslovakiaDenmarkDominicaDominican RepublicEastern AfricaEastern AsiaEastern EuropeEcuadorEgyptEl SalvadorEnglandEritreaEthiopiaEuropeFijiFranceGermanyGhanaGreeceGrenadaGuatemalaGuyanaHaitiHondurasHong KongHungaryIndiaIndonesiaIranIraqIrelandIsraelItalyJamaicaJapanJordanKazakhstanKenyaKoreaKuwaitLaosLatin AmericaLatviaLebanonLiberiaLithuaniaMalaysiaMexicoMicronesiaMiddle AfricaMoldovaMoroccoNepalNetherlandsNicaraguaNigeriaNorth AmericaNorth MacedoniaNorthern AfricaNorthern EuropeNorwayOceaniaPakistanPanamaPeruPhilippinesPolandPortugalRomaniaRussiaSaudi ArabiaScotlandSenegalSerbiaSierra LeoneSingaporeSomaliaSouth AfricaSouth AmericaSouth Central AsiaSouth Eastern AsiaSouthern EuropeSpainSri LankaSt. Vincent and the GrenadinesSudanSwedenSwitzerlandSyriaTaiwanThailandTrinidad and TobagoTurkeyUgandaUkraineUruguayUzbekistanVenezuelaVietnamWest IndiesWestern AfricaWestern AsiaWestern EuropeYemenZaireZimbabweAzores
College, Under 1 year
Income
Poverty
Unemployment
Labor Participation
Family Structure
Vehicle Availability
Education Level
Disability

Albanian College, Under 1 year
Good

65.9%
COLLEGE, UNDER 1 YEAR
66.1/ 100
METRIC RATING
160th/ 347
METRIC RANK

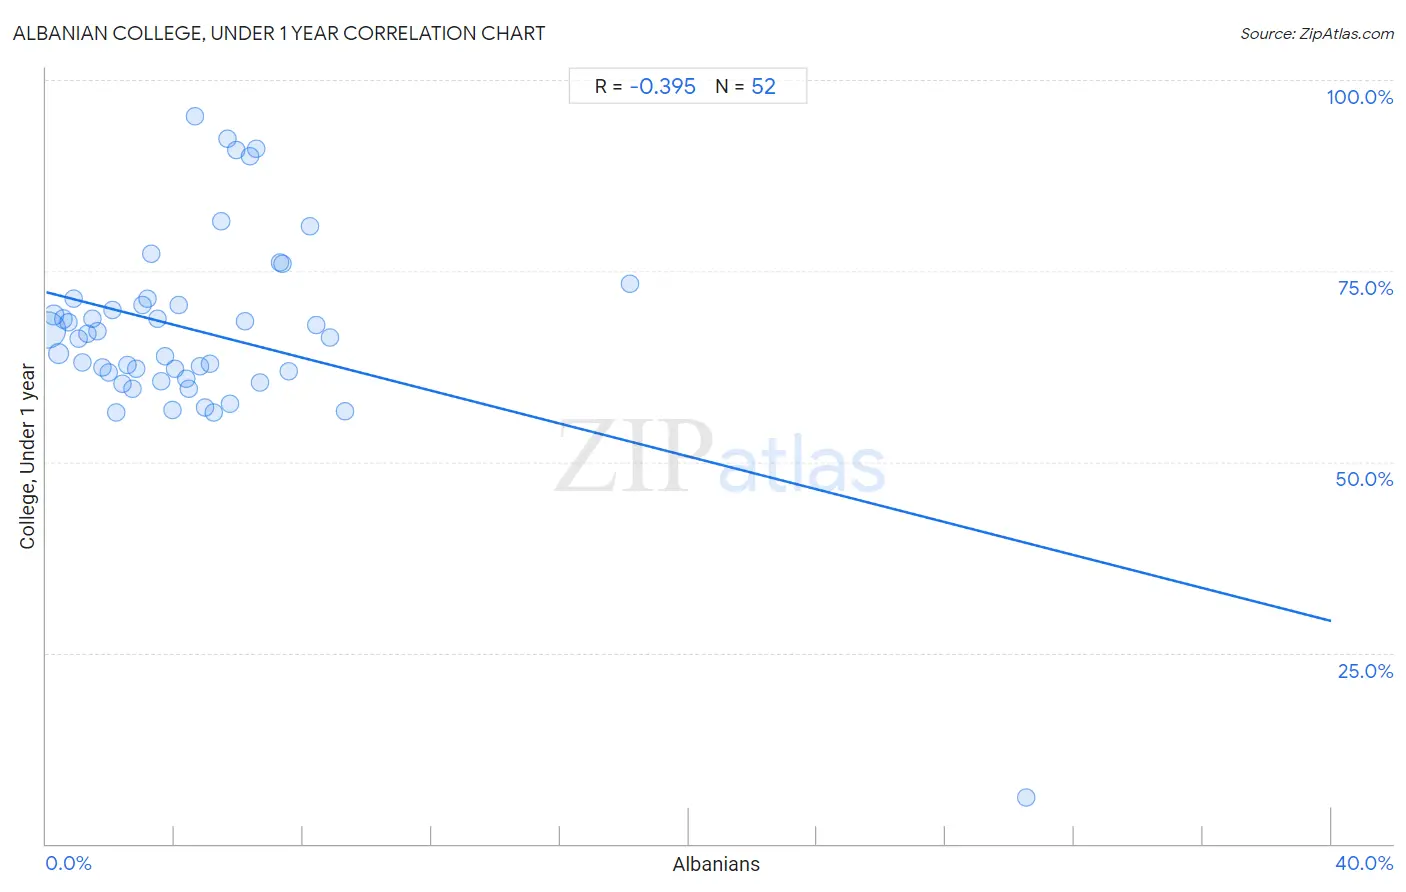
Albanian College, Under 1 year Correlation Chart

The statistical analysis conducted on geographies consisting of 193,265,850 people shows a mild negative correlation between the proportion of Albanians and percentage of population with at least college, under 1 year education in the United States with a correlation coefficient (R) of -0.395 and weighted average of 65.9%. On average, for every 1% (one percent) increase in Albanians within a typical geography, there is a decrease of 1.1% in percentage of population with at least college, under 1 year education.
Albanian College, Under 1 year
It is essential to understand that the correlation between the percentage of Albanians and percentage of population with at least college, under 1 year education does not imply a direct cause-and-effect relationship. It remains uncertain whether the presence of Albanians influences an upward or downward trend in the level of percentage of population with at least college, under 1 year education within an area, or if Albanians simply ended up residing in those areas with higher or lower levels of percentage of population with at least college, under 1 year education due to other factors.

Demographics Similar to Albanians by College, Under 1 year

In terms of college, under 1 year, the demographic groups most similar to Albanians are Tlingit-Haida (65.9%, a difference of 0.010%), Brazilian (65.9%, a difference of 0.010%), Korean (65.9%, a difference of 0.040%), Celtic (65.9%, a difference of 0.060%), and Sierra Leonean (66.0%, a difference of 0.080%).
DemographicsRating | RankCollege, Under 1 year
Belgians
73.7
/100
|
#153
Good
66.2%
Immigrants from Eritrea
71.9
/100
|
#154
Good
66.1%
Irish
70.3
/100
|
#155
Good
66.0%
Welsh
69.9
/100
|
#156
Good
66.0%
Sierra Leoneans
67.8
/100
|
#157
Good
66.0%
Celtics
67.3
/100
|
#158
Good
65.9%
Tlingit-Haida
66.4
/100
|
#159
Good
65.9%
Albanians
66.1
/100
|
#160
Good
65.9%
Brazilians
66.0
/100
|
#161
Good
65.9%
Koreans
65.3
/100
|
#162
Good
65.9%
Somalis
62.7
/100
|
#163
Good
65.8%
Czechoslovakians
62.6
/100
|
#164
Good
65.8%
Immigrants from Uzbekistan
61.6
/100
|
#165
Good
65.8%
Moroccans
56.7
/100
|
#166
Average
65.6%
Immigrants from Somalia
56.4
/100
|
#167
Average
65.6%

Albanian College, Under 1 year Correlation Summary

MeasurementAlbanian DataCollege, Under 1 year Data
Minimum0.043%6.0%
Maximum30.5%95.3%
Range30.5%89.3%
Mean4.8%67.1%
Median4.0%66.5%
Interquartile 25% (IQ1)2.0%61.3%
Interquartile 75% (IQ3)6.0%70.9%
Interquartile Range (IQR)4.0%9.6%
Standard Deviation (Sample)4.8%13.1%
Standard Deviation (Population)4.8%13.0%

Correlation Details

Albanian PercentileSample SizeCollege, Under 1 year
[
0.0%
-
0.5%
]
0.043%
136,126,41867.3%
[
0.0%
-
0.5%
]
0.21%
18,120,53869.2%
[
0.0%
-
0.5%
]
0.40%
20,181,95564.1%
[
0.5%
-
1.0%
]
0.53%
5,084,27068.7%
[
0.5%
-
1.0%
]
0.68%
3,440,95168.3%
[
0.5%
-
1.0%
]
0.84%
1,717,44571.4%
[
0.5%
-
1.0%
]
1.00%
1,364,62866.2%
[
1.0%
-
1.5%
]
1.14%
1,361,05363.1%
[
1.0%
-
1.5%
]
1.30%
1,034,16866.7%
[
1.0%
-
1.5%
]
1.44%
585,67868.8%
[
1.5%
-
2.0%
]
1.60%
477,24967.1%
[
1.5%
-
2.0%
]
1.75%
740,27062.3%
[
1.5%
-
2.0%
]
1.95%
412,93361.8%
[
2.0%
-
2.5%
]
2.08%
225,00469.8%
[
2.0%
-
2.5%
]
2.18%
496,87756.4%
[
2.0%
-
2.5%
]
2.36%
280,82260.2%
[
2.5%
-
3.0%
]
2.53%
442,93462.7%
[
2.5%
-
3.0%
]
2.69%
151,15159.6%
[
2.5%
-
3.0%
]
2.80%
198,76862.3%
[
3.0%
-
3.5%
]
3.01%
142,43070.6%
[
3.0%
-
3.5%
]
3.17%
84,04171.3%
[
3.0%
-
3.5%
]
3.26%
53,74077.3%
[
3.0%
-
3.5%
]
3.45%
101,54168.7%
[
3.5%
-
4.0%
]
3.59%
96,80360.5%
[
3.5%
-
4.0%
]
3.71%
85,57563.8%
[
3.5%
-
4.0%
]
3.93%
74,33556.8%
[
4.0%
-
4.5%
]
4.03%
8,96662.2%
[
4.0%
-
4.5%
]
4.13%
7,94870.5%
[
4.0%
-
4.5%
]
4.34%
13,77760.8%
[
4.0%
-
4.5%
]
4.43%
33,89459.5%
[
4.5%
-
5.0%
]
4.63%
5,33895.3%
[
4.5%
-
5.0%
]
4.80%
2,93762.4%
[
4.5%
-
5.0%
]
4.93%
30,41357.1%
[
5.0%
-
5.5%
]
5.08%
57162.9%
[
5.0%
-
5.5%
]
5.20%
17356.5%
[
5.0%
-
5.5%
]
5.47%
2,41581.5%
[
5.5%
-
6.0%
]
5.63%
1,35092.4%
[
5.5%
-
6.0%
]
5.72%
41,32857.5%
[
5.5%
-
6.0%
]
5.92%
7,33790.9%
[
6.0%
-
6.5%
]
6.17%
3,30468.3%
[
6.0%
-
6.5%
]
6.32%
3,70090.1%
[
6.5%
-
7.0%
]
6.53%
38391.0%
[
6.5%
-
7.0%
]
6.64%
2,04760.5%
[
7.0%
-
7.5%
]
7.28%
2,33676.2%
[
7.0%
-
7.5%
]
7.37%
1,65675.9%
[
7.5%
-
8.0%
]
7.54%
2,01761.9%
[
8.0%
-
8.5%
]
8.19%
89180.9%
[
8.0%
-
8.5%
]
8.41%
2,35368.0%
[
8.5%
-
9.0%
]
8.82%
6,65366.3%
[
9.0%
-
9.5%
]
9.30%
1,40956.6%
[
18.0%
-
18.5%
]
18.16%
93673.4%
[
30.0%
-
30.5%
]
30.50%
1416.0%