Albanian Disability
COMPARE
Albanian
Select to Compare
Disability
Albanian Disability
11.7%
DISABILITY
50.0/ 100
METRIC RATING
174th/ 347
METRIC RANK
Albanian Disability Correlation Chart
The statistical analysis conducted on geographies consisting of 193,262,883 people shows a mild positive correlation between the proportion of Albanians and percentage of population with a disability in the United States with a correlation coefficient (R) of 0.398 and weighted average of 11.7%. On average, for every 1% (one percent) increase in Albanians within a typical geography, there is an increase of 0.22% in percentage of population with a disability.
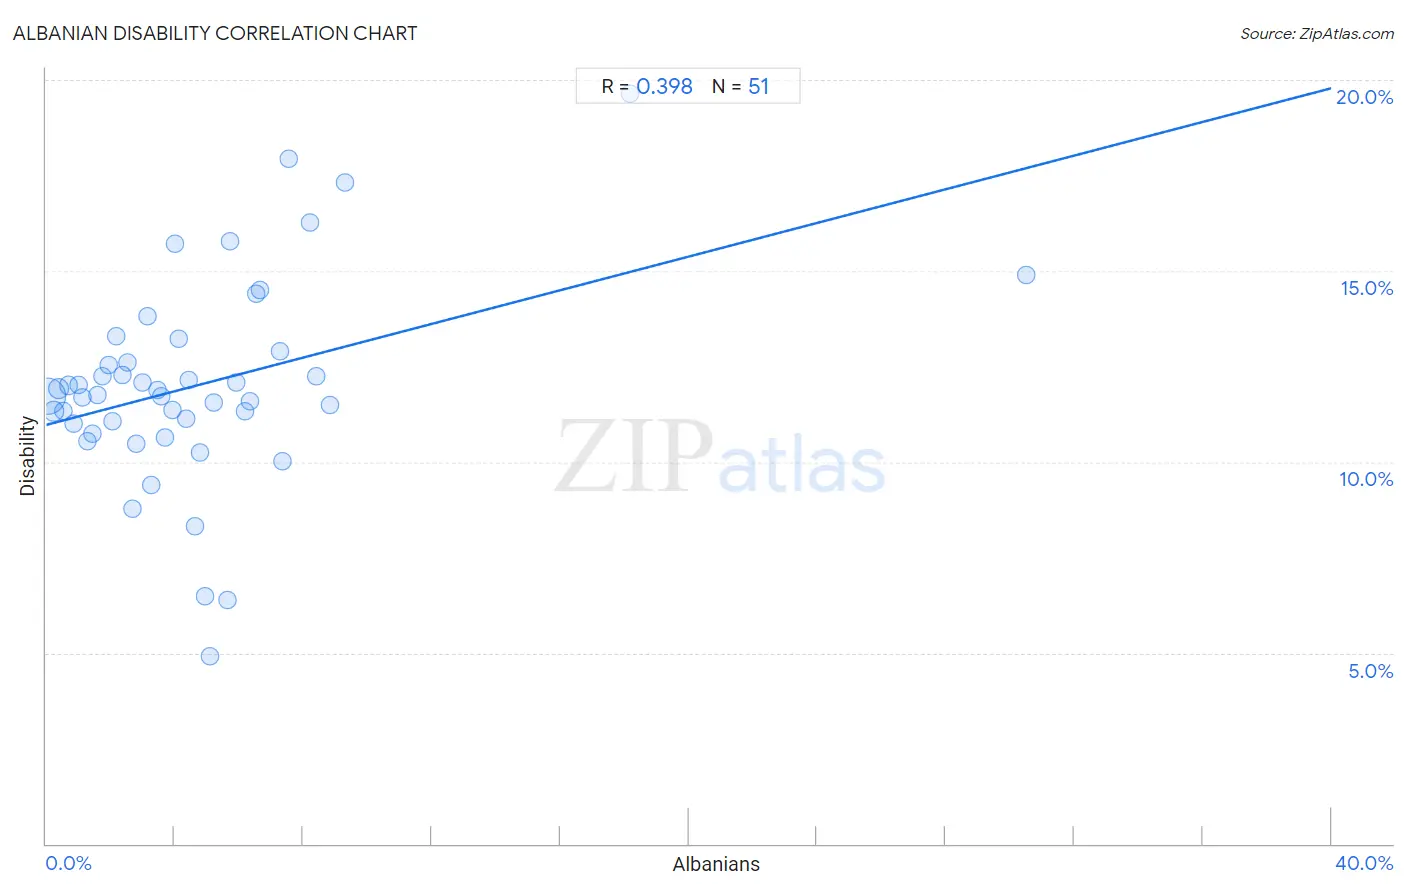
It is essential to understand that the correlation between the percentage of Albanians and percentage of population with a disability does not imply a direct cause-and-effect relationship. It remains uncertain whether the presence of Albanians influences an upward or downward trend in the level of percentage of population with a disability within an area, or if Albanians simply ended up residing in those areas with higher or lower levels of percentage of population with a disability due to other factors.
Demographics Similar to Albanians by Disability
In terms of disability, the demographic groups most similar to Albanians are Maltese (11.7%, a difference of 0.030%), Haitian (11.7%, a difference of 0.060%), Immigrants from Western Africa (11.7%, a difference of 0.11%), Immigrants from Albania (11.7%, a difference of 0.12%), and Immigrants from Southern Europe (11.7%, a difference of 0.12%).
| Demographics | Rating | Rank | Disability |
| Estonians | 54.4 /100 | #167 | Average 11.7% |
| Immigrants from Latin America | 54.1 /100 | #168 | Average 11.7% |
| Immigrants from Austria | 53.4 /100 | #169 | Average 11.7% |
| Immigrants from Albania | 52.8 /100 | #170 | Average 11.7% |
| Immigrants from Southern Europe | 52.8 /100 | #171 | Average 11.7% |
| Trinidadians and Tobagonians | 52.7 /100 | #172 | Average 11.7% |
| Maltese | 50.6 /100 | #173 | Average 11.7% |
| Albanians | 50.0 /100 | #174 | Average 11.7% |
| Haitians | 48.6 /100 | #175 | Average 11.7% |
| Immigrants from Western Africa | 47.5 /100 | #176 | Average 11.7% |
| Immigrants from Central America | 46.6 /100 | #177 | Average 11.7% |
| Greeks | 46.2 /100 | #178 | Average 11.7% |
| Immigrants from Armenia | 41.9 /100 | #179 | Average 11.7% |
| Immigrants from Honduras | 37.8 /100 | #180 | Fair 11.8% |
| Immigrants from Oceania | 34.3 /100 | #181 | Fair 11.8% |
Albanian Disability Correlation Summary
| Measurement | Albanian Data | Disability Data |
| Minimum | 0.043% | 4.9% |
| Maximum | 30.5% | 19.7% |
| Range | 30.5% | 14.8% |
| Mean | 4.7% | 12.0% |
| Median | 3.9% | 11.7% |
| Interquartile 25% (IQ1) | 1.9% | 11.0% |
| Interquartile 75% (IQ3) | 6.2% | 12.9% |
| Interquartile Range (IQR) | 4.2% | 1.9% |
| Standard Deviation (Sample) | 4.8% | 2.7% |
| Standard Deviation (Population) | 4.8% | 2.7% |
Correlation Details
| Albanian Percentile | Sample Size | Disability |
[ 0.0% - 0.5% ] 0.043% | 136,126,418 | 11.7% |
[ 0.0% - 0.5% ] 0.21% | 18,120,538 | 11.3% |
[ 0.0% - 0.5% ] 0.40% | 20,181,955 | 11.9% |
[ 0.5% - 1.0% ] 0.53% | 5,084,270 | 11.3% |
[ 0.5% - 1.0% ] 0.68% | 3,440,951 | 12.0% |
[ 0.5% - 1.0% ] 0.84% | 1,717,445 | 11.0% |
[ 0.5% - 1.0% ] 1.00% | 1,364,158 | 12.0% |
[ 1.0% - 1.5% ] 1.14% | 1,361,053 | 11.7% |
[ 1.0% - 1.5% ] 1.30% | 1,034,168 | 10.5% |
[ 1.0% - 1.5% ] 1.44% | 585,678 | 10.7% |
[ 1.5% - 2.0% ] 1.60% | 477,249 | 11.7% |
[ 1.5% - 2.0% ] 1.75% | 740,270 | 12.3% |
[ 1.5% - 2.0% ] 1.95% | 412,933 | 12.5% |
[ 2.0% - 2.5% ] 2.08% | 225,004 | 11.1% |
[ 2.0% - 2.5% ] 2.18% | 496,877 | 13.3% |
[ 2.0% - 2.5% ] 2.36% | 280,740 | 12.3% |
[ 2.5% - 3.0% ] 2.53% | 442,934 | 12.6% |
[ 2.5% - 3.0% ] 2.69% | 151,151 | 8.8% |
[ 2.5% - 3.0% ] 2.80% | 198,768 | 10.5% |
[ 3.0% - 3.5% ] 3.01% | 142,430 | 12.1% |
[ 3.0% - 3.5% ] 3.17% | 84,041 | 13.8% |
[ 3.0% - 3.5% ] 3.26% | 53,740 | 9.4% |
[ 3.0% - 3.5% ] 3.45% | 101,541 | 11.9% |
[ 3.5% - 4.0% ] 3.59% | 96,803 | 11.7% |
[ 3.5% - 4.0% ] 3.71% | 85,575 | 10.6% |
[ 3.5% - 4.0% ] 3.93% | 74,335 | 11.4% |
[ 4.0% - 4.5% ] 4.03% | 8,966 | 15.7% |
[ 4.0% - 4.5% ] 4.13% | 7,948 | 13.2% |
[ 4.0% - 4.5% ] 4.34% | 13,777 | 11.1% |
[ 4.0% - 4.5% ] 4.43% | 33,894 | 12.1% |
[ 4.5% - 5.0% ] 4.63% | 5,338 | 8.3% |
[ 4.5% - 5.0% ] 4.80% | 2,937 | 10.2% |
[ 4.5% - 5.0% ] 4.93% | 30,413 | 6.5% |
[ 5.0% - 5.5% ] 5.08% | 571 | 4.9% |
[ 5.0% - 5.5% ] 5.20% | 173 | 11.6% |
[ 5.5% - 6.0% ] 5.63% | 1,350 | 6.4% |
[ 5.5% - 6.0% ] 5.72% | 41,328 | 15.8% |
[ 5.5% - 6.0% ] 5.92% | 7,337 | 12.1% |
[ 6.0% - 6.5% ] 6.17% | 3,304 | 11.3% |
[ 6.0% - 6.5% ] 6.32% | 3,700 | 11.6% |
[ 6.5% - 7.0% ] 6.53% | 383 | 14.4% |
[ 6.5% - 7.0% ] 6.64% | 2,047 | 14.5% |
[ 7.0% - 7.5% ] 7.28% | 2,336 | 12.9% |
[ 7.0% - 7.5% ] 7.37% | 1,656 | 10.0% |
[ 7.5% - 8.0% ] 7.54% | 2,017 | 17.9% |
[ 8.0% - 8.5% ] 8.19% | 891 | 16.3% |
[ 8.0% - 8.5% ] 8.41% | 2,353 | 12.2% |
[ 8.5% - 9.0% ] 8.82% | 6,653 | 11.5% |
[ 9.0% - 9.5% ] 9.30% | 1,409 | 17.3% |
[ 18.0% - 18.5% ] 18.16% | 936 | 19.7% |
[ 30.0% - 30.5% ] 30.50% | 141 | 14.9% |