Albanian Receiving Food Stamps
COMPARE
Albanian
Select to Compare
Receiving Food Stamps
Albanian Receiving Food Stamps
12.0%
PUBLIC INCOME | FOOD STAMPS
35.4/ 100
METRIC RATING
187th/ 347
METRIC RANK
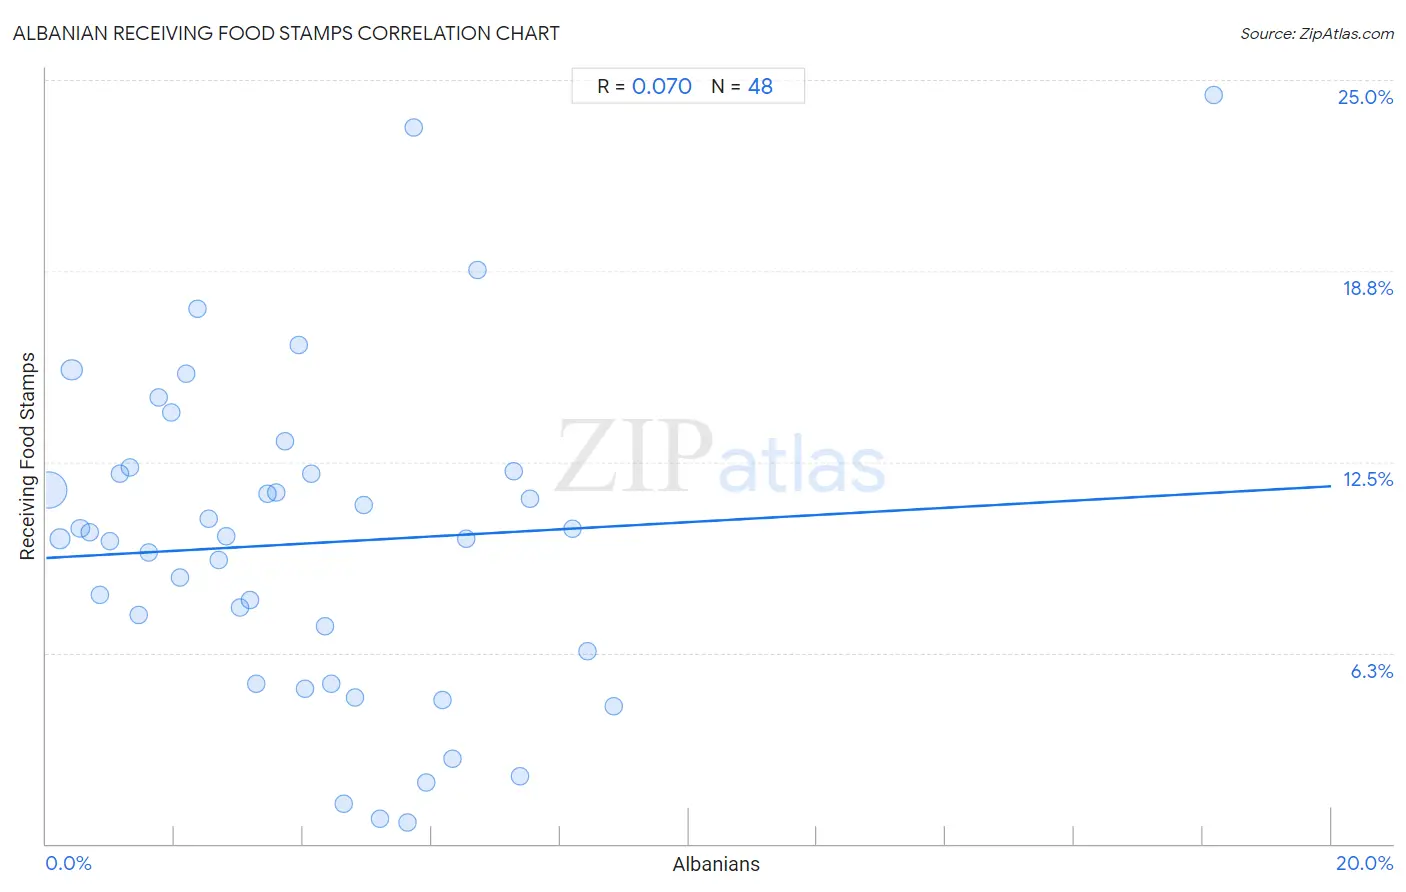
Albanian Receiving Food Stamps Correlation Chart
The statistical analysis conducted on geographies consisting of 192,875,347 people shows a slight positive correlation between the proportion of Albanians and percentage of population receiving government assistance and/or food stamps in the United States with a correlation coefficient (R) of 0.070 and weighted average of 12.0%. On average, for every 1% (one percent) increase in Albanians within a typical geography, there is an increase of 0.12% in percentage of population receiving government assistance and/or food stamps.
It is essential to understand that the correlation between the percentage of Albanians and percentage of population receiving government assistance and/or food stamps does not imply a direct cause-and-effect relationship. It remains uncertain whether the presence of Albanians influences an upward or downward trend in the level of percentage of population receiving government assistance and/or food stamps within an area, or if Albanians simply ended up residing in those areas with higher or lower levels of percentage of population receiving government assistance and/or food stamps due to other factors.
Demographics Similar to Albanians by Receiving Food Stamps
In terms of receiving food stamps, the demographic groups most similar to Albanians are Spanish (12.0%, a difference of 0.22%), Immigrants from Iraq (12.0%, a difference of 0.25%), Sudanese (12.0%, a difference of 0.31%), Immigrants from Cameroon (12.0%, a difference of 0.44%), and Immigrants from Peru (12.0%, a difference of 0.50%).
| Demographics | Rating | Rank | Receiving Food Stamps |
| Uruguayans | 44.8 /100 | #180 | Average 11.8% |
| South American Indians | 41.7 /100 | #181 | Average 11.9% |
| Immigrants from Morocco | 40.7 /100 | #182 | Average 11.9% |
| Immigrants from Uganda | 40.3 /100 | #183 | Average 11.9% |
| Spaniards | 39.8 /100 | #184 | Fair 11.9% |
| Immigrants from Iraq | 37.1 /100 | #185 | Fair 12.0% |
| Spanish | 36.9 /100 | #186 | Fair 12.0% |
| Albanians | 35.4 /100 | #187 | Fair 12.0% |
| Sudanese | 33.4 /100 | #188 | Fair 12.0% |
| Immigrants from Cameroon | 32.5 /100 | #189 | Fair 12.0% |
| Immigrants from Peru | 32.2 /100 | #190 | Fair 12.0% |
| Venezuelans | 32.1 /100 | #191 | Fair 12.0% |
| Samoans | 31.0 /100 | #192 | Fair 12.1% |
| Immigrants from Fiji | 27.8 /100 | #193 | Fair 12.1% |
| Immigrants from Sudan | 27.1 /100 | #194 | Fair 12.1% |
Albanian Receiving Food Stamps Correlation Summary
| Measurement | Albanian Data | Receiving Food Stamps Data |
| Minimum | 0.043% | 0.70% |
| Maximum | 18.2% | 24.5% |
| Range | 18.1% | 23.8% |
| Mean | 4.1% | 9.8% |
| Median | 3.7% | 10.0% |
| Interquartile 25% (IQ1) | 1.8% | 5.8% |
| Interquartile 75% (IQ3) | 5.8% | 12.2% |
| Interquartile Range (IQR) | 4.0% | 6.4% |
| Standard Deviation (Sample) | 3.2% | 5.3% |
| Standard Deviation (Population) | 3.1% | 5.2% |
Correlation Details
| Albanian Percentile | Sample Size | Receiving Food Stamps |
[ 0.0% - 0.5% ] 0.043% | 135,974,288 | 11.6% |
[ 0.0% - 0.5% ] 0.21% | 18,036,332 | 10.0% |
[ 0.0% - 0.5% ] 0.40% | 20,128,056 | 15.5% |
[ 0.5% - 1.0% ] 0.53% | 5,063,852 | 10.3% |
[ 0.5% - 1.0% ] 0.68% | 3,424,830 | 10.2% |
[ 0.5% - 1.0% ] 0.84% | 1,707,863 | 8.2% |
[ 0.5% - 1.0% ] 1.00% | 1,360,228 | 9.9% |
[ 1.0% - 1.5% ] 1.14% | 1,353,360 | 12.1% |
[ 1.0% - 1.5% ] 1.30% | 1,032,055 | 12.3% |
[ 1.0% - 1.5% ] 1.44% | 583,818 | 7.5% |
[ 1.5% - 2.0% ] 1.60% | 469,520 | 9.5% |
[ 1.5% - 2.0% ] 1.75% | 735,530 | 14.6% |
[ 1.5% - 2.0% ] 1.95% | 412,107 | 14.1% |
[ 2.0% - 2.5% ] 2.08% | 225,004 | 8.7% |
[ 2.0% - 2.5% ] 2.18% | 496,877 | 15.4% |
[ 2.0% - 2.5% ] 2.36% | 278,398 | 17.5% |
[ 2.5% - 3.0% ] 2.53% | 442,934 | 10.6% |
[ 2.5% - 3.0% ] 2.69% | 146,523 | 9.3% |
[ 2.5% - 3.0% ] 2.80% | 198,768 | 10.1% |
[ 3.0% - 3.5% ] 3.01% | 140,821 | 7.7% |
[ 3.0% - 3.5% ] 3.17% | 84,041 | 8.0% |
[ 3.0% - 3.5% ] 3.27% | 49,354 | 5.2% |
[ 3.0% - 3.5% ] 3.45% | 100,860 | 11.5% |
[ 3.5% - 4.0% ] 3.59% | 96,803 | 11.5% |
[ 3.5% - 4.0% ] 3.71% | 82,965 | 13.2% |
[ 3.5% - 4.0% ] 3.93% | 72,972 | 16.3% |
[ 4.0% - 4.5% ] 4.03% | 8,966 | 5.1% |
[ 4.0% - 4.5% ] 4.12% | 7,282 | 12.1% |
[ 4.0% - 4.5% ] 4.34% | 13,777 | 7.1% |
[ 4.0% - 4.5% ] 4.43% | 33,894 | 5.2% |
[ 4.5% - 5.0% ] 4.63% | 5,338 | 1.3% |
[ 4.5% - 5.0% ] 4.80% | 2,937 | 4.8% |
[ 4.5% - 5.0% ] 4.93% | 30,413 | 11.1% |
[ 5.0% - 5.5% ] 5.20% | 173 | 0.80% |
[ 5.5% - 6.0% ] 5.63% | 1,350 | 0.70% |
[ 5.5% - 6.0% ] 5.72% | 41,328 | 23.5% |
[ 5.5% - 6.0% ] 5.92% | 7,337 | 2.0% |
[ 6.0% - 6.5% ] 6.17% | 3,304 | 4.7% |
[ 6.0% - 6.5% ] 6.32% | 3,700 | 2.8% |
[ 6.5% - 7.0% ] 6.53% | 383 | 10.0% |
[ 6.5% - 7.0% ] 6.71% | 164 | 18.8% |
[ 7.0% - 7.5% ] 7.28% | 2,336 | 12.2% |
[ 7.0% - 7.5% ] 7.37% | 1,656 | 2.2% |
[ 7.5% - 8.0% ] 7.54% | 2,017 | 11.3% |
[ 8.0% - 8.5% ] 8.19% | 891 | 10.3% |
[ 8.0% - 8.5% ] 8.41% | 2,353 | 6.3% |
[ 8.5% - 9.0% ] 8.82% | 6,653 | 4.5% |
[ 18.0% - 18.5% ] 18.16% | 936 | 24.5% |