Immigrants from Cabo Verde 3 or more Vehicles in Household

COMPARE

Immigrants from Cabo Verde
Race
Ancestry
AfghanAfricanAlaska NativeAlaskan AthabascanAlbanianAleutAlsatianAmericanApacheArabArapahoArgentineanArmenianAssyrian/Chaldean/SyriacAustralianAustrianBahamianBangladeshiBarbadianBasqueBelgianBelizeanBermudanBhutaneseBlackfeetBolivianBrazilianBritishBritish West IndianBulgarianBurmeseCajunCambodianCanadianCape VerdeanCarpatho RusynCelticCentral AmericanCentral American IndianCherokeeCheyenneChickasawChileanChineseChippewaChoctawColombianColvilleComancheCosta RicanCreeCreekCroatianCrowCubanCypriotCzechCzechoslovakianDanishDelawareDominicanDutchDutch West IndianEastern EuropeanEcuadorianEgyptianEnglishEstonianEthiopianEuropeanFijianFilipinoFinnishFrenchFrench American IndianFrench CanadianGermanGerman RussianGhanaianGreekGuamanian/ChamorroGuatemalanGuyaneseHaitianHmongHonduranHopiHoumaHungarianIcelanderIndian (Asian)IndonesianInupiatIranianIraqiIrishIroquoisIsraeliItalianJamaicanJapaneseJordanianKenyanKiowaKoreanLaotianLatvianLebaneseLiberianLithuanianLumbeeLuxembourgerMacedonianMalaysianMalteseMarshalleseMenomineeMexicanMexican American IndianMongolianMoroccanNative HawaiianNavajoNepaleseNew ZealanderNicaraguanNigerianNorthern EuropeanNorwegianOkinawanOsageOttawaPaiutePakistaniPalestinianPanamanianParaguayanPennsylvania GermanPeruvianPimaPolishPortuguesePotawatomiPuebloPuerto RicanPuget Sound SalishRomanianRussianSalvadoranSamoanScandinavianScotch-IrishScottishSeminoleSenegaleseSerbianShoshoneSierra LeoneanSiouxSlavicSlovakSloveneSomaliSouth AfricanSouth AmericanSouth American IndianSoviet UnionSpaniardSpanishSpanish AmericanSpanish American IndianSri LankanSubsaharan AfricanSudaneseSwedishSwissSyrianTaiwaneseThaiTlingit-HaidaTohono O'OdhamTonganTrinidadian and TobagonianTsimshianTurkishU.S. Virgin IslanderUgandanUkrainianUruguayanUteVenezuelanVietnameseWelshWest IndianYakamaYaquiYugoslavianYumanYup'ikZimbabwean
Immigration
NonimmigrantsImmigrantsAfghanistanAfricaAlbaniaArgentinaArmeniaAsiaAustraliaAustriaBahamasBangladeshBarbadosBelarusBelgiumBelizeBoliviaBosnia and HerzegovinaBrazilBulgariaBurma/MyanmarCabo VerdeCambodiaCameroonCanadaCaribbeanCentral AmericaChileChinaColombiaCongoCosta RicaCroatiaCubaCzechoslovakiaDenmarkDominicaDominican RepublicEastern AfricaEastern AsiaEastern EuropeEcuadorEgyptEl SalvadorEnglandEritreaEthiopiaEuropeFijiFranceGermanyGhanaGreeceGrenadaGuatemalaGuyanaHaitiHondurasHong KongHungaryIndiaIndonesiaIranIraqIrelandIsraelItalyJamaicaJapanJordanKazakhstanKenyaKoreaKuwaitLaosLatin AmericaLatviaLebanonLiberiaLithuaniaMalaysiaMexicoMicronesiaMiddle AfricaMoldovaMoroccoNepalNetherlandsNicaraguaNigeriaNorth AmericaNorth MacedoniaNorthern AfricaNorthern EuropeNorwayOceaniaPakistanPanamaPeruPhilippinesPolandPortugalRomaniaRussiaSaudi ArabiaScotlandSenegalSerbiaSierra LeoneSingaporeSomaliaSouth AfricaSouth AmericaSouth Central AsiaSouth Eastern AsiaSouthern EuropeSpainSri LankaSt. Vincent and the GrenadinesSudanSwedenSwitzerlandSyriaTaiwanThailandTrinidad and TobagoTurkeyUgandaUkraineUruguayUzbekistanVenezuelaVietnamWest IndiesWestern AfricaWestern AsiaWestern EuropeYemenZaireZimbabweAzores
Select to Compare
Race
Ancestry
AfghanAfricanAlaska NativeAlaskan AthabascanAlbanianAleutAlsatianAmericanApacheArabArapahoArgentineanArmenianAssyrian/Chaldean/SyriacAustralianAustrianBahamianBangladeshiBarbadianBasqueBelgianBelizeanBermudanBhutaneseBlackfeetBolivianBrazilianBritishBritish West IndianBulgarianBurmeseCajunCambodianCanadianCape VerdeanCarpatho RusynCelticCentral AmericanCentral American IndianCherokeeCheyenneChickasawChileanChineseChippewaChoctawColombianColvilleComancheCosta RicanCreeCreekCroatianCrowCubanCypriotCzechCzechoslovakianDanishDelawareDominicanDutchDutch West IndianEastern EuropeanEcuadorianEgyptianEnglishEstonianEthiopianEuropeanFijianFilipinoFinnishFrenchFrench American IndianFrench CanadianGermanGerman RussianGhanaianGreekGuamanian/ChamorroGuatemalanGuyaneseHaitianHmongHonduranHopiHoumaHungarianIcelanderIndian (Asian)IndonesianInupiatIranianIraqiIrishIroquoisIsraeliItalianJamaicanJapaneseJordanianKenyanKiowaKoreanLaotianLatvianLebaneseLiberianLithuanianLumbeeLuxembourgerMacedonianMalaysianMalteseMarshalleseMenomineeMexicanMexican American IndianMongolianMoroccanNative HawaiianNavajoNepaleseNew ZealanderNicaraguanNigerianNorthern EuropeanNorwegianOkinawanOsageOttawaPaiutePakistaniPalestinianPanamanianParaguayanPennsylvania GermanPeruvianPimaPolishPortuguesePotawatomiPuebloPuerto RicanPuget Sound SalishRomanianRussianSalvadoranSamoanScandinavianScotch-IrishScottishSeminoleSenegaleseSerbianShoshoneSierra LeoneanSiouxSlavicSlovakSloveneSomaliSouth AfricanSouth AmericanSouth American IndianSoviet UnionSpaniardSpanishSpanish AmericanSpanish American IndianSri LankanSubsaharan AfricanSudaneseSwedishSwissSyrianTaiwaneseThaiTlingit-HaidaTohono O'OdhamTonganTrinidadian and TobagonianTsimshianTurkishU.S. Virgin IslanderUgandanUkrainianUruguayanUteVenezuelanVietnameseWelshWest IndianYakamaYaquiYugoslavianYumanYup'ikZimbabwean
Immigration
NonimmigrantsImmigrantsAfghanistanAfricaAlbaniaArgentinaArmeniaAsiaAustraliaAustriaBahamasBangladeshBarbadosBelarusBelgiumBelizeBoliviaBosnia and HerzegovinaBrazilBulgariaBurma/MyanmarCambodiaCameroonCanadaCaribbeanCentral AmericaChileChinaColombiaCongoCosta RicaCroatiaCubaCzechoslovakiaDenmarkDominicaDominican RepublicEastern AfricaEastern AsiaEastern EuropeEcuadorEgyptEl SalvadorEnglandEritreaEthiopiaEuropeFijiFranceGermanyGhanaGreeceGrenadaGuatemalaGuyanaHaitiHondurasHong KongHungaryIndiaIndonesiaIranIraqIrelandIsraelItalyJamaicaJapanJordanKazakhstanKenyaKoreaKuwaitLaosLatin AmericaLatviaLebanonLiberiaLithuaniaMalaysiaMexicoMicronesiaMiddle AfricaMoldovaMoroccoNepalNetherlandsNicaraguaNigeriaNorth AmericaNorth MacedoniaNorthern AfricaNorthern EuropeNorwayOceaniaPakistanPanamaPeruPhilippinesPolandPortugalRomaniaRussiaSaudi ArabiaScotlandSenegalSerbiaSierra LeoneSingaporeSomaliaSouth AfricaSouth AmericaSouth Central AsiaSouth Eastern AsiaSouthern EuropeSpainSri LankaSt. Vincent and the GrenadinesSudanSwedenSwitzerlandSyriaTaiwanThailandTrinidad and TobagoTurkeyUgandaUkraineUruguayUzbekistanVenezuelaVietnamWest IndiesWestern AfricaWestern AsiaWestern EuropeYemenZaireZimbabweAzores
3 or more Vehicles in Household
Income
Poverty
Unemployment
Labor Participation
Family Structure
Vehicle Availability
Education Level
Disability

Immigrants from Cabo Verde 3 or more Vehicles in Household
Tragic

13.6%
3+ VEHICLES AVAILABLE
0.0/ 100
METRIC RATING
333rd/ 347
METRIC RANK

Immigrants from Cabo Verde 3 or more Vehicles in Household Correlation Chart

The statistical analysis conducted on geographies consisting of 38,144,039 people shows a poor negative correlation between the proportion of Immigrants from Cabo Verde and percentage of households with 3 or more vehicles available in the United States with a correlation coefficient (R) of -0.151 and weighted average of 13.6%. On average, for every 1% (one percent) increase in Immigrants from Cabo Verde within a typical geography, there is a decrease of 0.30% in percentage of households with 3 or more vehicles available.
Immigrants from Cabo Verde 3 or more Vehicles in Household
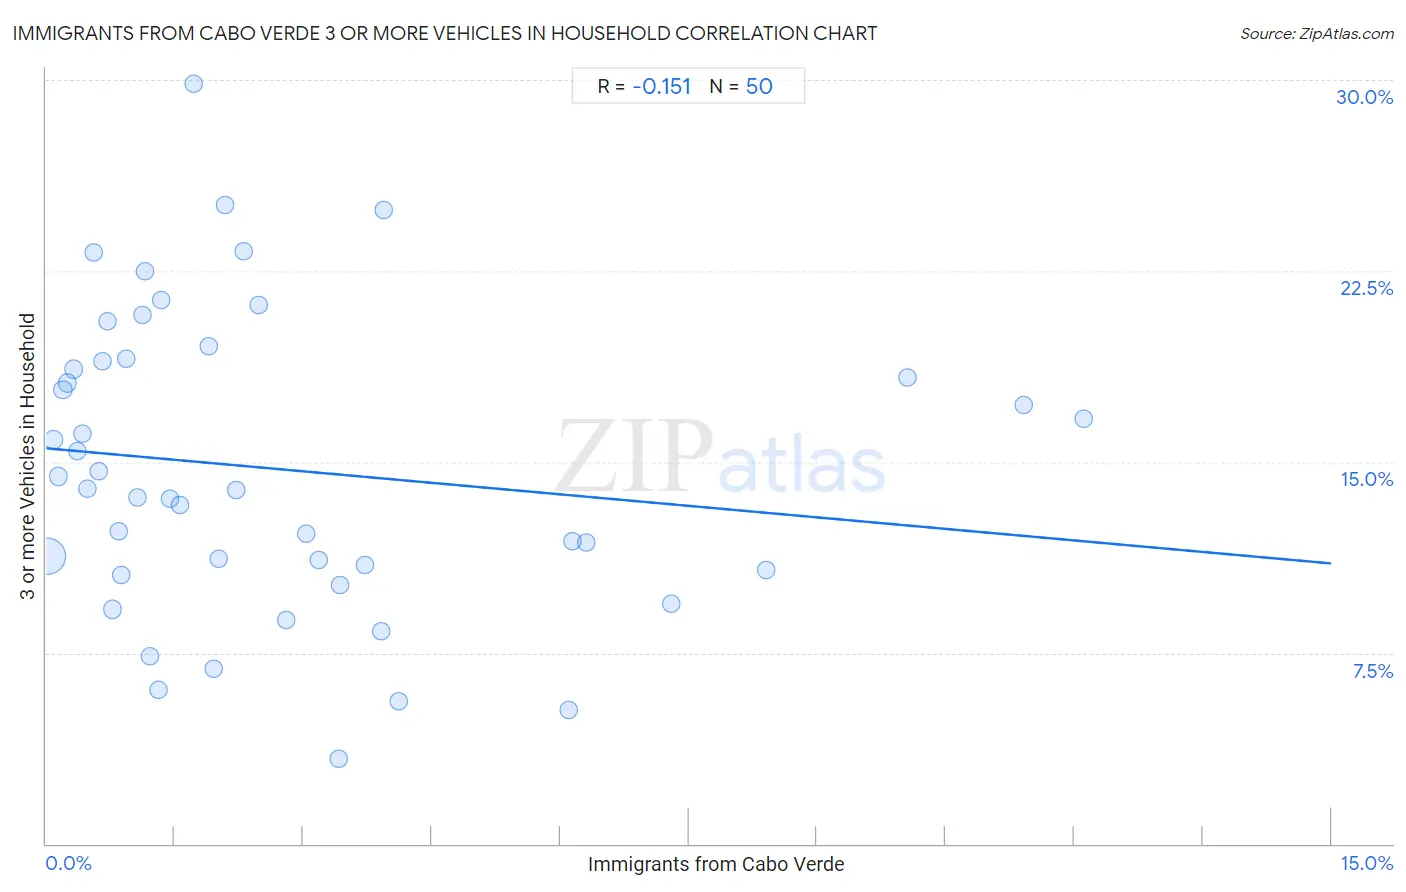
It is essential to understand that the correlation between the percentage of Immigrants from Cabo Verde and percentage of households with 3 or more vehicles available does not imply a direct cause-and-effect relationship. It remains uncertain whether the presence of Immigrants from Cabo Verde influences an upward or downward trend in the level of percentage of households with 3 or more vehicles available within an area, or if Immigrants from Cabo Verde simply ended up residing in those areas with higher or lower levels of percentage of households with 3 or more vehicles available due to other factors.

Demographics Similar to Immigrants from Cabo Verde by 3 or more Vehicles in Household

In terms of 3 or more vehicles in household, the demographic groups most similar to Immigrants from Cabo Verde are Trinidadian and Tobagonian (13.6%, a difference of 0.36%), Immigrants from Dominica (13.7%, a difference of 1.1%), Immigrants from Ecuador (13.4%, a difference of 1.3%), West Indian (13.7%, a difference of 1.3%), and Immigrants from Senegal (13.8%, a difference of 1.6%).
DemographicsRating | Rank3 or more Vehicles in Household
Soviet Union
0.0
/100
|
#326
Tragic
14.2%
Ecuadorians
0.0
/100
|
#327
Tragic
14.1%
Immigrants from Albania
0.0
/100
|
#328
Tragic
14.0%
Immigrants from Senegal
0.0
/100
|
#329
Tragic
13.8%
West Indians
0.0
/100
|
#330
Tragic
13.7%
Immigrants from Dominica
0.0
/100
|
#331
Tragic
13.7%
Trinidadians and Tobagonians
0.0
/100
|
#332
Tragic
13.6%
Immigrants from Cabo Verde
0.0
/100
|
#333
Tragic
13.6%
Immigrants from Ecuador
0.0
/100
|
#334
Tragic
13.4%
Immigrants from Trinidad and Tobago
0.0
/100
|
#335
Tragic
13.3%
Barbadians
0.0
/100
|
#336
Tragic
12.6%
Immigrants from Bangladesh
0.0
/100
|
#337
Tragic
12.5%
Vietnamese
0.0
/100
|
#338
Tragic
12.5%
Immigrants from Uzbekistan
0.0
/100
|
#339
Tragic
12.0%
Immigrants from Barbados
0.0
/100
|
#340
Tragic
11.7%

Immigrants from Cabo Verde 3 or more Vehicles in Household Correlation Summary

MeasurementImmigrants from Cabo Verde Data3 or more Vehicles in Household Data
Minimum0.0084%3.3%
Maximum12.1%29.8%
Range12.1%26.5%
Mean2.7%14.7%
Median1.6%13.9%
Interquartile 25% (IQ1)0.72%10.8%
Interquartile 75% (IQ3)3.4%18.9%
Interquartile Range (IQR)2.7%8.2%
Standard Deviation (Sample)2.9%5.9%
Standard Deviation (Population)2.9%5.8%

Correlation Details

Immigrants from Cabo Verde PercentileSample Size3 or more Vehicles in Household
[
0.0%
-
0.5%
]
0.0084%
29,053,37411.3%
[
0.0%
-
0.5%
]
0.081%
2,771,38815.9%
[
0.0%
-
0.5%
]
0.14%
1,300,89614.4%
[
0.0%
-
0.5%
]
0.19%
726,40817.8%
[
0.0%
-
0.5%
]
0.25%
413,35318.1%
[
0.0%
-
0.5%
]
0.32%
420,59218.6%
[
0.0%
-
0.5%
]
0.37%
373,41715.4%
[
0.0%
-
0.5%
]
0.42%
110,04616.1%
[
0.0%
-
0.5%
]
0.48%
269,03413.9%
[
0.5%
-
1.0%
]
0.56%
75,87723.2%
[
0.5%
-
1.0%
]
0.62%
73,65914.6%
[
0.5%
-
1.0%
]
0.66%
63,73118.9%
[
0.5%
-
1.0%
]
0.72%
28,08020.5%
[
0.5%
-
1.0%
]
0.78%
161,6639.2%
[
0.5%
-
1.0%
]
0.85%
27,75312.3%
[
0.5%
-
1.0%
]
0.88%
86,19210.5%
[
0.5%
-
1.0%
]
0.93%
49,71819.1%
[
1.0%
-
1.5%
]
1.07%
85,45613.6%
[
1.0%
-
1.5%
]
1.13%
107,39820.8%
[
1.0%
-
1.5%
]
1.16%
29,83322.5%
[
1.0%
-
1.5%
]
1.21%
60,9387.4%
[
1.0%
-
1.5%
]
1.31%
724,2406.1%
[
1.0%
-
1.5%
]
1.34%
48,69421.4%
[
1.0%
-
1.5%
]
1.44%
110,23713.6%
[
1.5%
-
2.0%
]
1.56%
7,69013.3%
[
1.5%
-
2.0%
]
1.72%
2,72629.8%
[
1.5%
-
2.0%
]
1.90%
25,08419.5%
[
1.5%
-
2.0%
]
1.95%
29,8206.9%
[
2.0%
-
2.5%
]
2.02%
17,16411.2%
[
2.0%
-
2.5%
]
2.08%
29,98325.1%
[
2.0%
-
2.5%
]
2.22%
27,52713.9%
[
2.0%
-
2.5%
]
2.31%
59,43623.3%
[
2.0%
-
2.5%
]
2.48%
51,91521.2%
[
2.5%
-
3.0%
]
2.80%
18,4458.8%
[
3.0%
-
3.5%
]
3.04%
100,62012.2%
[
3.0%
-
3.5%
]
3.18%
46,62311.2%
[
3.0%
-
3.5%
]
3.42%
26,8213.3%
[
3.0%
-
3.5%
]
3.43%
12,46510.2%
[
3.5%
-
4.0%
]
3.73%
44,71811.0%
[
3.5%
-
4.0%
]
3.91%
55,3368.4%
[
3.5%
-
4.0%
]
3.94%
5,07424.9%
[
4.0%
-
4.5%
]
4.11%
16,2865.6%
[
6.0%
-
6.5%
]
6.09%
31,9035.2%
[
6.0%
-
6.5%
]
6.14%
75,17611.9%
[
6.0%
-
6.5%
]
6.30%
5,44211.8%
[
7.0%
-
7.5%
]
7.30%
24,7059.4%
[
8.0%
-
8.5%
]
8.40%
47,67710.8%
[
10.0%
-
10.5%
]
10.06%
35,48818.3%
[
11.0%
-
11.5%
]
11.41%
104,71317.3%
[
12.0%
-
12.5%
]
12.11%
69,22516.7%