Immigrants from Cabo Verde vs Polish Married-couple Households

COMPARE

Immigrants from Cabo Verde
Race
Ancestry
AfghanAfricanAlaska NativeAlaskan AthabascanAlbanianAleutAlsatianAmericanApacheArabArapahoArgentineanArmenianAssyrian/Chaldean/SyriacAustralianAustrianBahamianBangladeshiBarbadianBasqueBelgianBelizeanBermudanBhutaneseBlackfeetBolivianBrazilianBritishBritish West IndianBulgarianBurmeseCajunCambodianCanadianCape VerdeanCarpatho RusynCelticCentral AmericanCentral American IndianCherokeeCheyenneChickasawChileanChineseChippewaChoctawColombianColvilleComancheCosta RicanCreeCreekCroatianCrowCubanCypriotCzechCzechoslovakianDanishDelawareDominicanDutchDutch West IndianEastern EuropeanEcuadorianEgyptianEnglishEstonianEthiopianEuropeanFijianFilipinoFinnishFrenchFrench American IndianFrench CanadianGermanGerman RussianGhanaianGreekGuamanian/ChamorroGuatemalanGuyaneseHaitianHmongHonduranHopiHoumaHungarianIcelanderIndian (Asian)IndonesianInupiatIranianIraqiIrishIroquoisIsraeliItalianJamaicanJapaneseJordanianKenyanKiowaKoreanLaotianLatvianLebaneseLiberianLithuanianLumbeeLuxembourgerMacedonianMalaysianMalteseMarshalleseMenomineeMexicanMexican American IndianMongolianMoroccanNative HawaiianNavajoNepaleseNew ZealanderNicaraguanNigerianNorthern EuropeanNorwegianOkinawanOsageOttawaPaiutePakistaniPalestinianPanamanianParaguayanPennsylvania GermanPeruvianPimaPortuguesePotawatomiPuebloPuerto RicanPuget Sound SalishRomanianRussianSalvadoranSamoanScandinavianScotch-IrishScottishSeminoleSenegaleseSerbianShoshoneSierra LeoneanSiouxSlavicSlovakSloveneSomaliSouth AfricanSouth AmericanSouth American IndianSoviet UnionSpaniardSpanishSpanish AmericanSpanish American IndianSri LankanSubsaharan AfricanSudaneseSwedishSwissSyrianTaiwaneseThaiTlingit-HaidaTohono O'OdhamTonganTrinidadian and TobagonianTsimshianTurkishU.S. Virgin IslanderUgandanUkrainianUruguayanUteVenezuelanVietnameseWelshWest IndianYakamaYaquiYugoslavianYumanYup'ikZimbabwean
Immigration
NonimmigrantsImmigrantsAfghanistanAfricaAlbaniaArgentinaArmeniaAsiaAustraliaAustriaBahamasBangladeshBarbadosBelarusBelgiumBelizeBoliviaBosnia and HerzegovinaBrazilBulgariaBurma/MyanmarCabo VerdeCambodiaCameroonCanadaCaribbeanCentral AmericaChileChinaColombiaCongoCosta RicaCroatiaCubaCzechoslovakiaDenmarkDominicaDominican RepublicEastern AfricaEastern AsiaEastern EuropeEcuadorEgyptEl SalvadorEnglandEritreaEthiopiaEuropeFijiFranceGermanyGhanaGreeceGrenadaGuatemalaGuyanaHaitiHondurasHong KongHungaryIndiaIndonesiaIranIraqIrelandIsraelItalyJamaicaJapanJordanKazakhstanKenyaKoreaKuwaitLaosLatin AmericaLatviaLebanonLiberiaLithuaniaMalaysiaMexicoMicronesiaMiddle AfricaMoldovaMoroccoNepalNetherlandsNicaraguaNigeriaNorth AmericaNorth MacedoniaNorthern AfricaNorthern EuropeNorwayOceaniaPakistanPanamaPeruPhilippinesPolandPortugalRomaniaRussiaSaudi ArabiaScotlandSenegalSerbiaSierra LeoneSingaporeSomaliaSouth AfricaSouth AmericaSouth Central AsiaSouth Eastern AsiaSouthern EuropeSpainSri LankaSt. Vincent and the GrenadinesSudanSwedenSwitzerlandSyriaTaiwanThailandTrinidad and TobagoTurkeyUgandaUkraineUruguayUzbekistanVenezuelaVietnamWest IndiesWestern AfricaWestern AsiaWestern EuropeYemenZaireZimbabweAzores
Polish
Race
Ancestry
AfghanAfricanAlaska NativeAlaskan AthabascanAlbanianAleutAlsatianAmericanApacheArabArapahoArgentineanArmenianAssyrian/Chaldean/SyriacAustralianAustrianBahamianBangladeshiBarbadianBasqueBelgianBelizeanBermudanBhutaneseBlackfeetBolivianBrazilianBritishBritish West IndianBulgarianBurmeseCajunCambodianCanadianCape VerdeanCarpatho RusynCelticCentral AmericanCentral American IndianCherokeeCheyenneChickasawChileanChineseChippewaChoctawColombianColvilleComancheCosta RicanCreeCreekCroatianCrowCubanCypriotCzechCzechoslovakianDanishDelawareDominicanDutchDutch West IndianEastern EuropeanEcuadorianEgyptianEnglishEstonianEthiopianEuropeanFijianFilipinoFinnishFrenchFrench American IndianFrench CanadianGermanGerman RussianGhanaianGreekGuamanian/ChamorroGuatemalanGuyaneseHaitianHmongHonduranHopiHoumaHungarianIcelanderIndian (Asian)IndonesianInupiatIranianIraqiIrishIroquoisIsraeliItalianJamaicanJapaneseJordanianKenyanKiowaKoreanLaotianLatvianLebaneseLiberianLithuanianLumbeeLuxembourgerMacedonianMalaysianMalteseMarshalleseMenomineeMexicanMexican American IndianMongolianMoroccanNative HawaiianNavajoNepaleseNew ZealanderNicaraguanNigerianNorthern EuropeanNorwegianOkinawanOsageOttawaPaiutePakistaniPalestinianPanamanianParaguayanPennsylvania GermanPeruvianPimaPolishPortuguesePotawatomiPuebloPuerto RicanPuget Sound SalishRomanianRussianSalvadoranSamoanScandinavianScotch-IrishScottishSeminoleSenegaleseSerbianShoshoneSierra LeoneanSiouxSlavicSlovakSloveneSomaliSouth AfricanSouth AmericanSouth American IndianSoviet UnionSpaniardSpanishSpanish AmericanSpanish American IndianSri LankanSubsaharan AfricanSudaneseSwedishSwissSyrianTaiwaneseThaiTlingit-HaidaTohono O'OdhamTonganTrinidadian and TobagonianTsimshianTurkishU.S. Virgin IslanderUgandanUkrainianUruguayanUteVenezuelanVietnameseWelshWest IndianYakamaYaquiYugoslavianYumanYup'ikZimbabwean
Immigration
NonimmigrantsImmigrantsAfghanistanAfricaAlbaniaArgentinaArmeniaAsiaAustraliaAustriaBahamasBangladeshBarbadosBelarusBelgiumBelizeBoliviaBosnia and HerzegovinaBrazilBulgariaBurma/MyanmarCambodiaCameroonCanadaCaribbeanCentral AmericaChileChinaColombiaCongoCosta RicaCroatiaCubaCzechoslovakiaDenmarkDominicaDominican RepublicEastern AfricaEastern AsiaEastern EuropeEcuadorEgyptEl SalvadorEnglandEritreaEthiopiaEuropeFijiFranceGermanyGhanaGreeceGrenadaGuatemalaGuyanaHaitiHondurasHong KongHungaryIndiaIndonesiaIranIraqIrelandIsraelItalyJamaicaJapanJordanKazakhstanKenyaKoreaKuwaitLaosLatin AmericaLatviaLebanonLiberiaLithuaniaMalaysiaMexicoMicronesiaMiddle AfricaMoldovaMoroccoNepalNetherlandsNicaraguaNigeriaNorth AmericaNorth MacedoniaNorthern AfricaNorthern EuropeNorwayOceaniaPakistanPanamaPeruPhilippinesPolandPortugalRomaniaRussiaSaudi ArabiaScotlandSenegalSerbiaSierra LeoneSingaporeSomaliaSouth AfricaSouth AmericaSouth Central AsiaSouth Eastern AsiaSouthern EuropeSpainSri LankaSt. Vincent and the GrenadinesSudanSwedenSwitzerlandSyriaTaiwanThailandTrinidad and TobagoTurkeyUgandaUkraineUruguayUzbekistanVenezuelaVietnamWest IndiesWestern AfricaWestern AsiaWestern EuropeYemenZaireZimbabweAzores
Married-couple Households
Income
Poverty
Unemployment
Labor Participation
Family Structure
Vehicle Availability
Education Level
Disability

Married-couple Households Comparison

Immigrants from Cabo Verde

Poles

Tragic
Exceptional
36.2%
MARRIED-COUPLE HOUSEHOLDS
0.0/ 100
METRIC RATING
346th/ 347
METRIC RANK
48.5%
MARRIED-COUPLE HOUSEHOLDS
99.2/ 100
METRIC RATING
57th/ 347
METRIC RANK

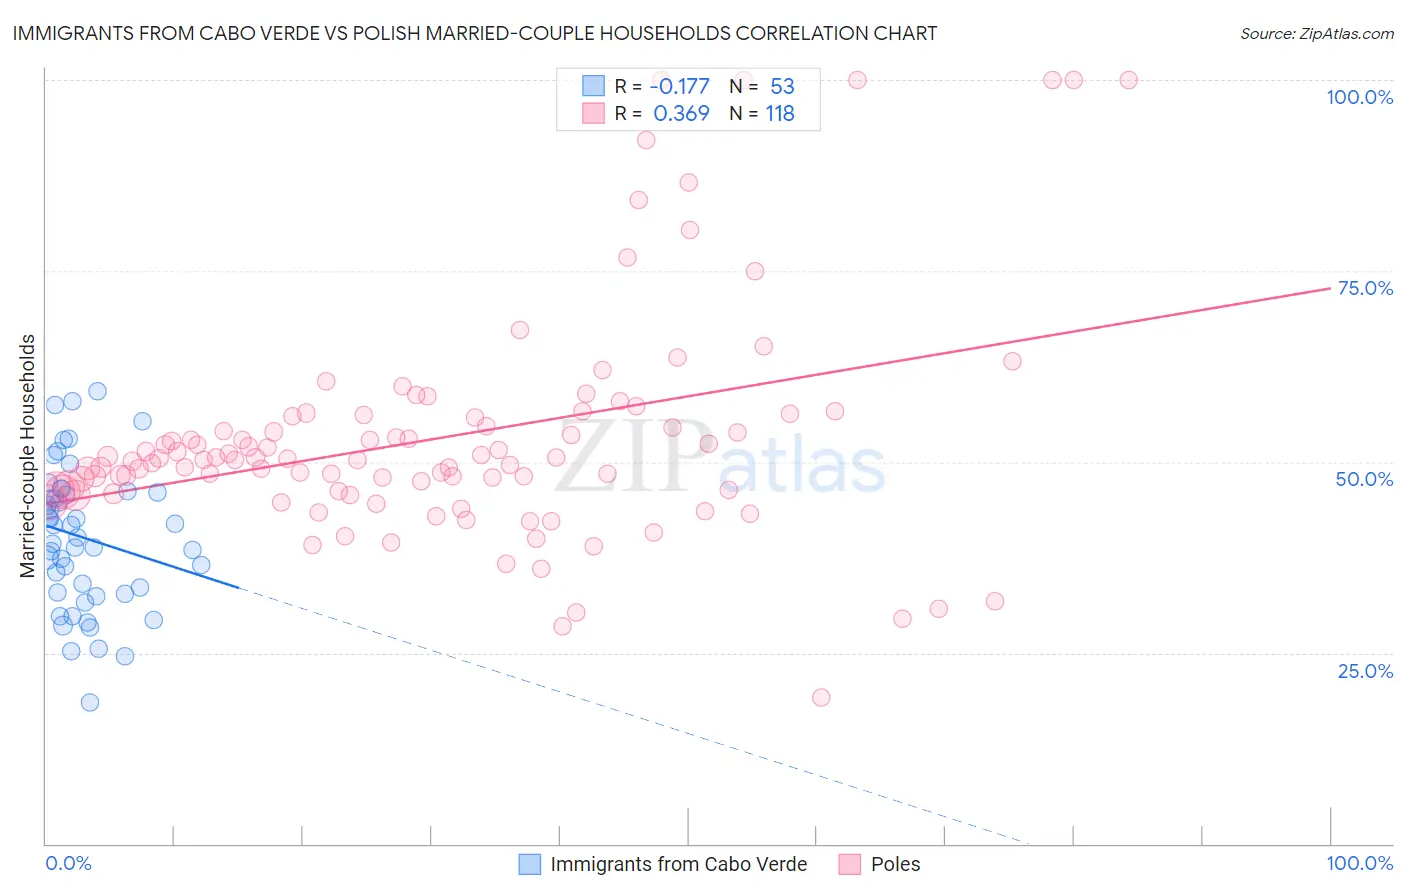
Immigrants from Cabo Verde vs Polish Married-couple Households Correlation Chart

The statistical analysis conducted on geographies consisting of 38,131,070 people shows a poor negative correlation between the proportion of Immigrants from Cabo Verde and percentage of married-couple family households in the United States with a correlation coefficient (R) of -0.177 and weighted average of 36.2%. Similarly, the statistical analysis conducted on geographies consisting of 559,940,539 people shows a mild positive correlation between the proportion of Poles and percentage of married-couple family households in the United States with a correlation coefficient (R) of 0.369 and weighted average of 48.5%, a difference of 34.0%.
Immigrants from Cabo Verde vs Polish Married-couple Households

Married-couple Households Correlation Summary

MeasurementImmigrants from Cabo VerdePolish
Minimum18.5%19.1%
Maximum59.3%100.0%
Range40.8%80.9%
Mean40.1%53.2%
Median40.1%50.3%
Interquartile 25% (IQ1)32.9%46.2%
Interquartile 75% (IQ3)46.1%56.0%
Interquartile Range (IQR)13.2%9.8%
Standard Deviation (Sample)9.3%15.2%
Standard Deviation (Population)9.2%15.1%

Similar Demographics by Married-couple Households

Demographics Similar to Immigrants from Cabo Verde by Married-couple Households

In terms of married-couple households, the demographic groups most similar to Immigrants from Cabo Verde are Hopi (36.7%, a difference of 1.2%), Pima (35.6%, a difference of 1.9%), Immigrants from Dominican Republic (37.3%, a difference of 3.0%), Immigrants from Grenada (37.5%, a difference of 3.5%), and Tohono O'odham (37.9%, a difference of 4.6%).
DemographicsRating | RankMarried-couple Households
Immigrants | West Indies
0.0
/100
|
#333
Tragic
39.0%
Immigrants | St. Vincent and the Grenadines
0.0
/100
|
#334
Tragic
38.7%
Senegalese
0.0
/100
|
#335
Tragic
38.6%
Blacks/African Americans
0.0
/100
|
#336
Tragic
38.5%
Immigrants | Somalia
0.0
/100
|
#337
Tragic
38.4%
Immigrants | Senegal
0.0
/100
|
#338
Tragic
38.4%
British West Indians
0.0
/100
|
#339
Tragic
38.3%
Dominicans
0.0
/100
|
#340
Tragic
38.2%
Cape Verdeans
0.0
/100
|
#341
Tragic
38.1%
Tohono O'odham
0.0
/100
|
#342
Tragic
37.9%
Immigrants | Grenada
0.0
/100
|
#343
Tragic
37.5%
Immigrants | Dominican Republic
0.0
/100
|
#344
Tragic
37.3%
Hopi
0.0
/100
|
#345
Tragic
36.7%
Immigrants | Cabo Verde
0.0
/100
|
#346
Tragic
36.2%
Pima
0.0
/100
|
#347
Tragic
35.6%

Demographics Similar to Poles by Married-couple Households

In terms of married-couple households, the demographic groups most similar to Poles are Immigrants from Indonesia (48.5%, a difference of 0.0%), Czechoslovakian (48.5%, a difference of 0.010%), Croatian (48.5%, a difference of 0.080%), Immigrants from Lithuania (48.6%, a difference of 0.090%), and Austrian (48.6%, a difference of 0.090%).
DemographicsRating | RankMarried-couple Households
Samoans
99.4
/100
|
#50
Exceptional
48.7%
Eastern Europeans
99.3
/100
|
#51
Exceptional
48.6%
Irish
99.3
/100
|
#52
Exceptional
48.6%
Whites/Caucasians
99.3
/100
|
#53
Exceptional
48.6%
Immigrants | Lithuania
99.3
/100
|
#54
Exceptional
48.6%
Austrians
99.3
/100
|
#55
Exceptional
48.6%
Immigrants | Northern Europe
99.3
/100
|
#56
Exceptional
48.6%
Poles
99.2
/100
|
#57
Exceptional
48.5%
Immigrants | Indonesia
99.2
/100
|
#58
Exceptional
48.5%
Czechoslovakians
99.2
/100
|
#59
Exceptional
48.5%
Croatians
99.1
/100
|
#60
Exceptional
48.5%
Bulgarians
99.1
/100
|
#61
Exceptional
48.5%
Luxembourgers
99.1
/100
|
#62
Exceptional
48.5%
Basques
99.0
/100
|
#63
Exceptional
48.4%
Northern Europeans
99.0
/100
|
#64
Exceptional
48.4%