Moroccan Disability
COMPARE
Moroccan
Select to Compare
Disability
Moroccan Disability
11.5%
DISABILITY
83.3/ 100
METRIC RATING
143rd/ 347
METRIC RANK
Moroccan Disability Correlation Chart
The statistical analysis conducted on geographies consisting of 201,799,768 people shows a poor positive correlation between the proportion of Moroccans and percentage of population with a disability in the United States with a correlation coefficient (R) of 0.106 and weighted average of 11.5%. On average, for every 1% (one percent) increase in Moroccans within a typical geography, there is an increase of 0.091% in percentage of population with a disability.
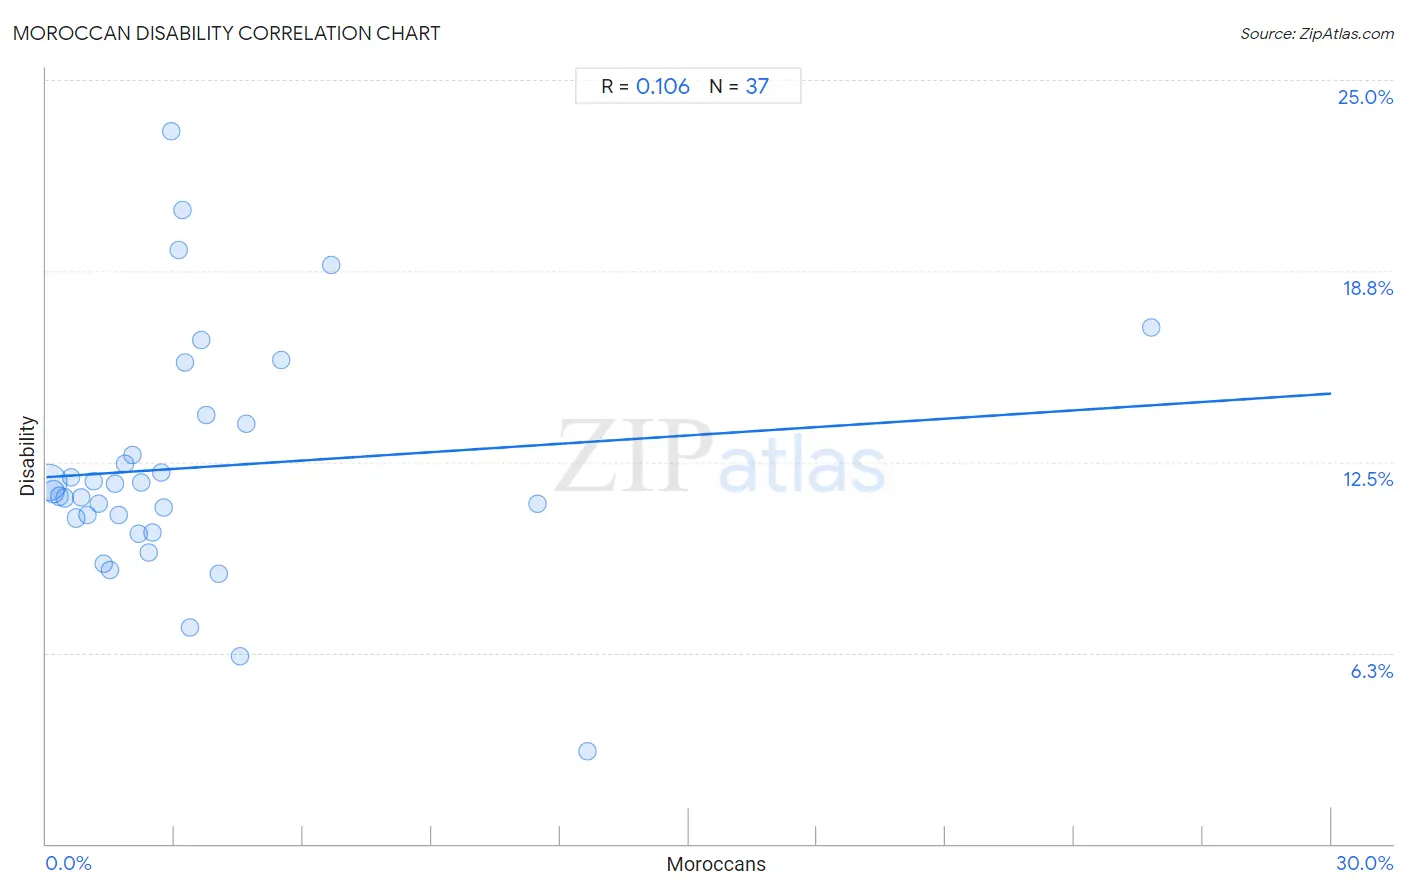
It is essential to understand that the correlation between the percentage of Moroccans and percentage of population with a disability does not imply a direct cause-and-effect relationship. It remains uncertain whether the presence of Moroccans influences an upward or downward trend in the level of percentage of population with a disability within an area, or if Moroccans simply ended up residing in those areas with higher or lower levels of percentage of population with a disability due to other factors.
Demographics Similar to Moroccans by Disability
In terms of disability, the demographic groups most similar to Moroccans are Australian (11.5%, a difference of 0.070%), Nigerian (11.5%, a difference of 0.15%), Immigrants from Sudan (11.5%, a difference of 0.17%), Immigrants from Grenada (11.5%, a difference of 0.25%), and Russian (11.5%, a difference of 0.31%).
| Demographics | Rating | Rank | Disability |
| Immigrants from St. Vincent and the Grenadines | 87.8 /100 | #136 | Excellent 11.4% |
| Kenyans | 87.1 /100 | #137 | Excellent 11.5% |
| New Zealanders | 87.0 /100 | #138 | Excellent 11.5% |
| Ghanaians | 87.0 /100 | #139 | Excellent 11.5% |
| Russians | 86.8 /100 | #140 | Excellent 11.5% |
| Immigrants from Grenada | 86.1 /100 | #141 | Excellent 11.5% |
| Immigrants from Sudan | 85.3 /100 | #142 | Excellent 11.5% |
| Moroccans | 83.3 /100 | #143 | Excellent 11.5% |
| Australians | 82.5 /100 | #144 | Excellent 11.5% |
| Nigerians | 81.3 /100 | #145 | Excellent 11.5% |
| Immigrants from Hungary | 79.0 /100 | #146 | Good 11.5% |
| Immigrants from Ukraine | 77.6 /100 | #147 | Good 11.5% |
| Sudanese | 77.1 /100 | #148 | Good 11.5% |
| Immigrants from Norway | 73.2 /100 | #149 | Good 11.6% |
| Romanians | 72.7 /100 | #150 | Good 11.6% |
Moroccan Disability Correlation Summary
| Measurement | Moroccan Data | Disability Data |
| Minimum | 0.046% | 3.0% |
| Maximum | 25.8% | 23.3% |
| Range | 25.7% | 20.3% |
| Mean | 3.5% | 12.3% |
| Median | 2.4% | 11.5% |
| Interquartile 25% (IQ1) | 1.2% | 10.4% |
| Interquartile 75% (IQ3) | 3.7% | 13.9% |
| Interquartile Range (IQR) | 2.5% | 3.5% |
| Standard Deviation (Sample) | 4.6% | 4.0% |
| Standard Deviation (Population) | 4.6% | 3.9% |
Correlation Details
| Moroccan Percentile | Sample Size | Disability |
[ 0.0% - 0.5% ] 0.046% | 147,568,913 | 11.8% |
[ 0.0% - 0.5% ] 0.17% | 33,429,403 | 11.5% |
[ 0.0% - 0.5% ] 0.31% | 8,870,723 | 11.4% |
[ 0.0% - 0.5% ] 0.44% | 4,356,646 | 11.3% |
[ 0.5% - 1.0% ] 0.57% | 2,429,659 | 12.0% |
[ 0.5% - 1.0% ] 0.70% | 1,635,226 | 10.7% |
[ 0.5% - 1.0% ] 0.82% | 1,060,813 | 11.3% |
[ 0.5% - 1.0% ] 0.95% | 560,521 | 10.8% |
[ 1.0% - 1.5% ] 1.10% | 300,125 | 11.9% |
[ 1.0% - 1.5% ] 1.22% | 472,512 | 11.1% |
[ 1.0% - 1.5% ] 1.34% | 148,615 | 9.1% |
[ 1.0% - 1.5% ] 1.48% | 250,431 | 9.0% |
[ 1.5% - 2.0% ] 1.60% | 132,664 | 11.8% |
[ 1.5% - 2.0% ] 1.70% | 19,227 | 10.8% |
[ 1.5% - 2.0% ] 1.85% | 115,696 | 12.4% |
[ 2.0% - 2.5% ] 2.01% | 18,033 | 12.7% |
[ 2.0% - 2.5% ] 2.15% | 64,963 | 10.1% |
[ 2.0% - 2.5% ] 2.23% | 213,400 | 11.8% |
[ 2.0% - 2.5% ] 2.39% | 37,065 | 9.5% |
[ 2.0% - 2.5% ] 2.48% | 13,603 | 10.2% |
[ 2.5% - 3.0% ] 2.70% | 6,379 | 12.1% |
[ 2.5% - 3.0% ] 2.73% | 31,771 | 11.0% |
[ 2.5% - 3.0% ] 2.91% | 9,656 | 23.3% |
[ 3.0% - 3.5% ] 3.09% | 5,917 | 19.4% |
[ 3.0% - 3.5% ] 3.19% | 188 | 20.7% |
[ 3.0% - 3.5% ] 3.24% | 5,371 | 15.8% |
[ 3.0% - 3.5% ] 3.37% | 19,531 | 7.1% |
[ 3.5% - 4.0% ] 3.63% | 8,207 | 16.5% |
[ 3.5% - 4.0% ] 3.74% | 935 | 14.0% |
[ 4.0% - 4.5% ] 4.02% | 1,020 | 8.8% |
[ 4.5% - 5.0% ] 4.52% | 6,123 | 6.2% |
[ 4.5% - 5.0% ] 4.67% | 2,508 | 13.8% |
[ 5.0% - 5.5% ] 5.48% | 2,499 | 15.8% |
[ 6.5% - 7.0% ] 6.67% | 465 | 18.9% |
[ 11.0% - 11.5% ] 11.46% | 314 | 11.1% |
[ 12.5% - 13.0% ] 12.65% | 332 | 3.0% |
[ 25.5% - 26.0% ] 25.80% | 314 | 16.9% |