Immigrants from Jordan vs Immigrants Married-couple Households
COMPARE
Immigrants from Jordan
Immigrants
Married-couple Households
Married-couple Households Comparison
Immigrants from Jordan
Immigrants
47.7%
MARRIED-COUPLE HOUSEHOLDS
94.1/ 100
METRIC RATING
109th/ 347
METRIC RANK
46.3%
MARRIED-COUPLE HOUSEHOLDS
43.8/ 100
METRIC RATING
177th/ 347
METRIC RANK
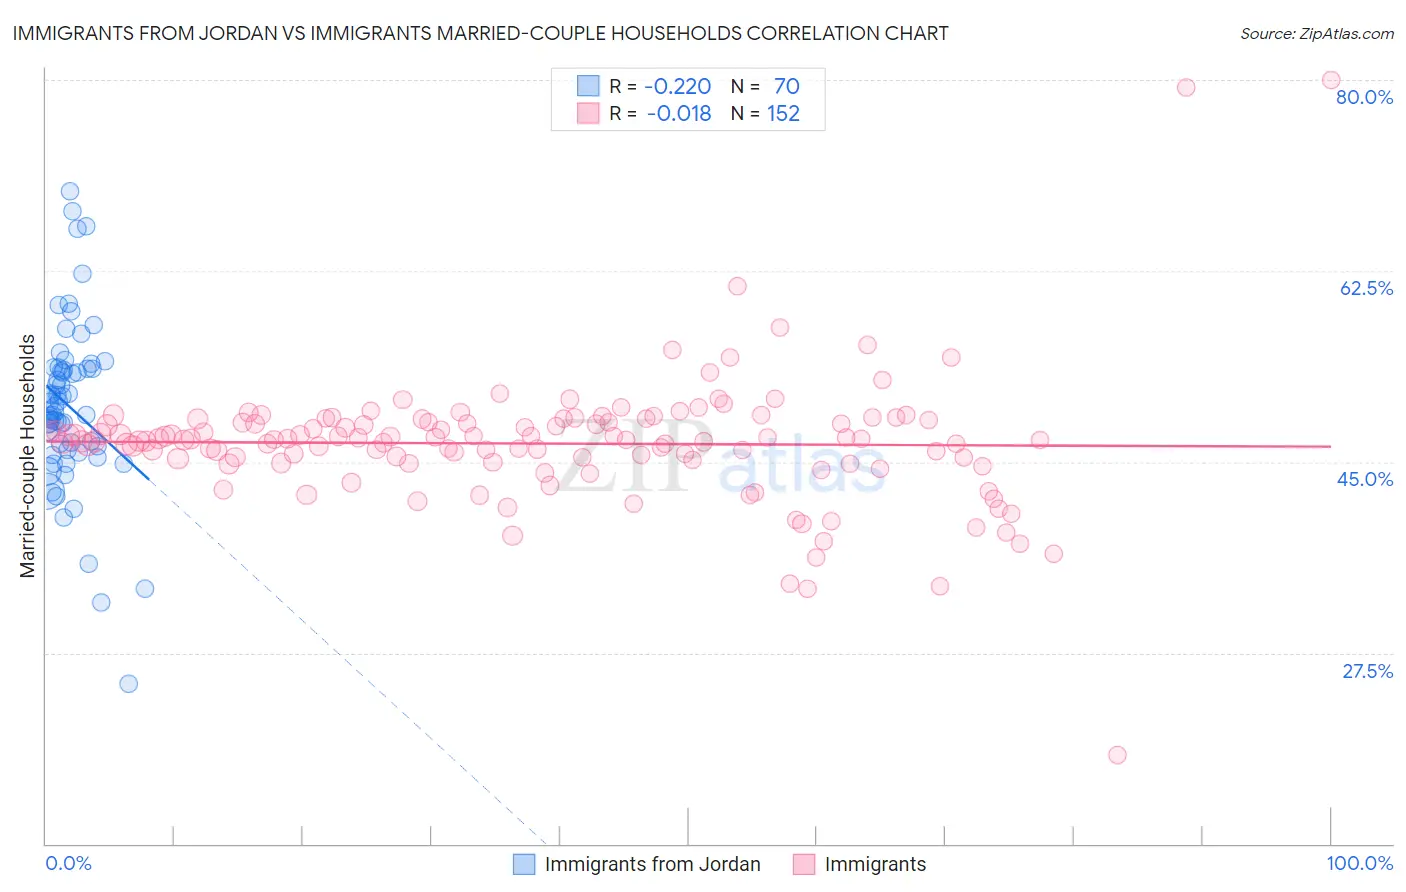
Immigrants from Jordan vs Immigrants Married-couple Households Correlation Chart
The statistical analysis conducted on geographies consisting of 181,252,999 people shows a weak negative correlation between the proportion of Immigrants from Jordan and percentage of married-couple family households in the United States with a correlation coefficient (R) of -0.220 and weighted average of 47.7%. Similarly, the statistical analysis conducted on geographies consisting of 577,047,094 people shows no correlation between the proportion of Immigrants and percentage of married-couple family households in the United States with a correlation coefficient (R) of -0.018 and weighted average of 46.3%, a difference of 2.8%.
Married-couple Households Correlation Summary
| Measurement | Immigrants from Jordan | Immigrants |
| Minimum | 24.7% | 18.2% |
| Maximum | 69.8% | 80.0% |
| Range | 45.1% | 61.8% |
| Mean | 50.1% | 46.7% |
| Median | 49.9% | 47.1% |
| Interquartile 25% (IQ1) | 46.0% | 45.1% |
| Interquartile 75% (IQ3) | 53.6% | 48.7% |
| Interquartile Range (IQR) | 7.5% | 3.7% |
| Standard Deviation (Sample) | 7.7% | 6.1% |
| Standard Deviation (Population) | 7.7% | 6.1% |
Similar Demographics by Married-couple Households
Demographics Similar to Immigrants from Jordan by Married-couple Households
In terms of married-couple households, the demographic groups most similar to Immigrants from Jordan are Macedonian (47.6%, a difference of 0.020%), Syrian (47.6%, a difference of 0.030%), Peruvian (47.6%, a difference of 0.040%), Immigrants from Japan (47.7%, a difference of 0.050%), and Venezuelan (47.6%, a difference of 0.050%).
| Demographics | Rating | Rank | Married-couple Households |
| Slavs | 96.0 /100 | #102 | Exceptional 47.8% |
| Hawaiians | 96.0 /100 | #103 | Exceptional 47.8% |
| Immigrants | South Africa | 96.0 /100 | #104 | Exceptional 47.8% |
| Immigrants | Czechoslovakia | 95.5 /100 | #105 | Exceptional 47.8% |
| Portuguese | 95.5 /100 | #106 | Exceptional 47.8% |
| Estonians | 94.7 /100 | #107 | Exceptional 47.7% |
| Immigrants | Japan | 94.4 /100 | #108 | Exceptional 47.7% |
| Immigrants | Jordan | 94.1 /100 | #109 | Exceptional 47.7% |
| Macedonians | 93.9 /100 | #110 | Exceptional 47.6% |
| Syrians | 93.9 /100 | #111 | Exceptional 47.6% |
| Peruvians | 93.8 /100 | #112 | Exceptional 47.6% |
| Venezuelans | 93.8 /100 | #113 | Exceptional 47.6% |
| Immigrants | Europe | 93.7 /100 | #114 | Exceptional 47.6% |
| Slovaks | 92.9 /100 | #115 | Exceptional 47.6% |
| Argentineans | 92.5 /100 | #116 | Exceptional 47.5% |
Demographics Similar to Immigrants by Married-couple Households
In terms of married-couple households, the demographic groups most similar to Immigrants are Immigrants from Costa Rica (46.3%, a difference of 0.020%), Immigrants from Zimbabwe (46.3%, a difference of 0.030%), Cajun (46.4%, a difference of 0.060%), Mongolian (46.3%, a difference of 0.070%), and Malaysian (46.3%, a difference of 0.080%).
| Demographics | Rating | Rank | Married-couple Households |
| South Americans | 58.0 /100 | #170 | Average 46.6% |
| Immigrants | Chile | 55.7 /100 | #171 | Average 46.5% |
| Immigrants | Australia | 54.6 /100 | #172 | Average 46.5% |
| Immigrants | Norway | 52.0 /100 | #173 | Average 46.5% |
| Immigrants | Mexico | 50.0 /100 | #174 | Average 46.4% |
| Immigrants | Colombia | 46.1 /100 | #175 | Average 46.4% |
| Cajuns | 45.2 /100 | #176 | Average 46.4% |
| Immigrants | Immigrants | 43.8 /100 | #177 | Average 46.3% |
| Immigrants | Costa Rica | 43.4 /100 | #178 | Average 46.3% |
| Immigrants | Zimbabwe | 43.0 /100 | #179 | Average 46.3% |
| Mongolians | 42.0 /100 | #180 | Average 46.3% |
| Malaysians | 41.8 /100 | #181 | Average 46.3% |
| Yugoslavians | 38.9 /100 | #182 | Fair 46.2% |
| Immigrants | Brazil | 38.3 /100 | #183 | Fair 46.2% |
| Immigrants | Switzerland | 36.9 /100 | #184 | Fair 46.2% |