Immigrants from Denmark GED/Equivalency

COMPARE

Immigrants from Denmark
Race
Ancestry
AfghanAfricanAlaska NativeAlaskan AthabascanAlbanianAleutAlsatianAmericanApacheArabArapahoArgentineanArmenianAssyrian/Chaldean/SyriacAustralianAustrianBahamianBangladeshiBarbadianBasqueBelgianBelizeanBermudanBhutaneseBlackfeetBolivianBrazilianBritishBritish West IndianBulgarianBurmeseCajunCambodianCanadianCape VerdeanCarpatho RusynCelticCentral AmericanCentral American IndianCherokeeCheyenneChickasawChileanChineseChippewaChoctawColombianColvilleComancheCosta RicanCreeCreekCroatianCrowCubanCypriotCzechCzechoslovakianDanishDelawareDominicanDutchDutch West IndianEastern EuropeanEcuadorianEgyptianEnglishEstonianEthiopianEuropeanFijianFilipinoFinnishFrenchFrench American IndianFrench CanadianGermanGerman RussianGhanaianGreekGuamanian/ChamorroGuatemalanGuyaneseHaitianHmongHonduranHopiHoumaHungarianIcelanderIndian (Asian)IndonesianInupiatIranianIraqiIrishIroquoisIsraeliItalianJamaicanJapaneseJordanianKenyanKiowaKoreanLaotianLatvianLebaneseLiberianLithuanianLumbeeLuxembourgerMacedonianMalaysianMalteseMarshalleseMenomineeMexicanMexican American IndianMongolianMoroccanNative HawaiianNavajoNepaleseNew ZealanderNicaraguanNigerianNorthern EuropeanNorwegianOkinawanOsageOttawaPaiutePakistaniPalestinianPanamanianParaguayanPennsylvania GermanPeruvianPimaPolishPortuguesePotawatomiPuebloPuerto RicanPuget Sound SalishRomanianRussianSalvadoranSamoanScandinavianScotch-IrishScottishSeminoleSenegaleseSerbianShoshoneSierra LeoneanSiouxSlavicSlovakSloveneSomaliSouth AfricanSouth AmericanSouth American IndianSoviet UnionSpaniardSpanishSpanish AmericanSpanish American IndianSri LankanSubsaharan AfricanSudaneseSwedishSwissSyrianTaiwaneseThaiTlingit-HaidaTohono O'OdhamTonganTrinidadian and TobagonianTsimshianTurkishU.S. Virgin IslanderUgandanUkrainianUruguayanUteVenezuelanVietnameseWelshWest IndianYakamaYaquiYugoslavianYumanYup'ikZimbabwean
Immigration
NonimmigrantsImmigrantsAfghanistanAfricaAlbaniaArgentinaArmeniaAsiaAustraliaAustriaBahamasBangladeshBarbadosBelarusBelgiumBelizeBoliviaBosnia and HerzegovinaBrazilBulgariaBurma/MyanmarCabo VerdeCambodiaCameroonCanadaCaribbeanCentral AmericaChileChinaColombiaCongoCosta RicaCroatiaCubaCzechoslovakiaDenmarkDominicaDominican RepublicEastern AfricaEastern AsiaEastern EuropeEcuadorEgyptEl SalvadorEnglandEritreaEthiopiaEuropeFijiFranceGermanyGhanaGreeceGrenadaGuatemalaGuyanaHaitiHondurasHong KongHungaryIndiaIndonesiaIranIraqIrelandIsraelItalyJamaicaJapanJordanKazakhstanKenyaKoreaKuwaitLaosLatin AmericaLatviaLebanonLiberiaLithuaniaMalaysiaMexicoMicronesiaMiddle AfricaMoldovaMoroccoNepalNetherlandsNicaraguaNigeriaNorth AmericaNorth MacedoniaNorthern AfricaNorthern EuropeNorwayOceaniaPakistanPanamaPeruPhilippinesPolandPortugalRomaniaRussiaSaudi ArabiaScotlandSenegalSerbiaSierra LeoneSingaporeSomaliaSouth AfricaSouth AmericaSouth Central AsiaSouth Eastern AsiaSouthern EuropeSpainSri LankaSt. Vincent and the GrenadinesSudanSwedenSwitzerlandSyriaTaiwanThailandTrinidad and TobagoTurkeyUgandaUkraineUruguayUzbekistanVenezuelaVietnamWest IndiesWestern AfricaWestern AsiaWestern EuropeYemenZaireZimbabweAzores
Select to Compare
Race
Ancestry
AfghanAfricanAlaska NativeAlaskan AthabascanAlbanianAleutAlsatianAmericanApacheArabArapahoArgentineanArmenianAssyrian/Chaldean/SyriacAustralianAustrianBahamianBangladeshiBarbadianBasqueBelgianBelizeanBermudanBhutaneseBlackfeetBolivianBrazilianBritishBritish West IndianBulgarianBurmeseCajunCambodianCanadianCape VerdeanCarpatho RusynCelticCentral AmericanCentral American IndianCherokeeCheyenneChickasawChileanChineseChippewaChoctawColombianColvilleComancheCosta RicanCreeCreekCroatianCrowCubanCypriotCzechCzechoslovakianDanishDelawareDominicanDutchDutch West IndianEastern EuropeanEcuadorianEgyptianEnglishEstonianEthiopianEuropeanFijianFilipinoFinnishFrenchFrench American IndianFrench CanadianGermanGerman RussianGhanaianGreekGuamanian/ChamorroGuatemalanGuyaneseHaitianHmongHonduranHopiHoumaHungarianIcelanderIndian (Asian)IndonesianInupiatIranianIraqiIrishIroquoisIsraeliItalianJamaicanJapaneseJordanianKenyanKiowaKoreanLaotianLatvianLebaneseLiberianLithuanianLumbeeLuxembourgerMacedonianMalaysianMalteseMarshalleseMenomineeMexicanMexican American IndianMongolianMoroccanNative HawaiianNavajoNepaleseNew ZealanderNicaraguanNigerianNorthern EuropeanNorwegianOkinawanOsageOttawaPaiutePakistaniPalestinianPanamanianParaguayanPennsylvania GermanPeruvianPimaPolishPortuguesePotawatomiPuebloPuerto RicanPuget Sound SalishRomanianRussianSalvadoranSamoanScandinavianScotch-IrishScottishSeminoleSenegaleseSerbianShoshoneSierra LeoneanSiouxSlavicSlovakSloveneSomaliSouth AfricanSouth AmericanSouth American IndianSoviet UnionSpaniardSpanishSpanish AmericanSpanish American IndianSri LankanSubsaharan AfricanSudaneseSwedishSwissSyrianTaiwaneseThaiTlingit-HaidaTohono O'OdhamTonganTrinidadian and TobagonianTsimshianTurkishU.S. Virgin IslanderUgandanUkrainianUruguayanUteVenezuelanVietnameseWelshWest IndianYakamaYaquiYugoslavianYumanYup'ikZimbabwean
Immigration
NonimmigrantsImmigrantsAfghanistanAfricaAlbaniaArgentinaArmeniaAsiaAustraliaAustriaBahamasBangladeshBarbadosBelarusBelgiumBelizeBoliviaBosnia and HerzegovinaBrazilBulgariaBurma/MyanmarCabo VerdeCambodiaCameroonCanadaCaribbeanCentral AmericaChileChinaColombiaCongoCosta RicaCroatiaCubaCzechoslovakiaDominicaDominican RepublicEastern AfricaEastern AsiaEastern EuropeEcuadorEgyptEl SalvadorEnglandEritreaEthiopiaEuropeFijiFranceGermanyGhanaGreeceGrenadaGuatemalaGuyanaHaitiHondurasHong KongHungaryIndiaIndonesiaIranIraqIrelandIsraelItalyJamaicaJapanJordanKazakhstanKenyaKoreaKuwaitLaosLatin AmericaLatviaLebanonLiberiaLithuaniaMalaysiaMexicoMicronesiaMiddle AfricaMoldovaMoroccoNepalNetherlandsNicaraguaNigeriaNorth AmericaNorth MacedoniaNorthern AfricaNorthern EuropeNorwayOceaniaPakistanPanamaPeruPhilippinesPolandPortugalRomaniaRussiaSaudi ArabiaScotlandSenegalSerbiaSierra LeoneSingaporeSomaliaSouth AfricaSouth AmericaSouth Central AsiaSouth Eastern AsiaSouthern EuropeSpainSri LankaSt. Vincent and the GrenadinesSudanSwedenSwitzerlandSyriaTaiwanThailandTrinidad and TobagoTurkeyUgandaUkraineUruguayUzbekistanVenezuelaVietnamWest IndiesWestern AfricaWestern AsiaWestern EuropeYemenZaireZimbabweAzores
GED/Equivalency
Income
Poverty
Unemployment
Labor Participation
Family Structure
Vehicle Availability
Education Level
Disability

Immigrants from Denmark GED/Equivalency
Exceptional

88.0%
GED/EQUIVALENCY
99.4/ 100
METRIC RATING
56th/ 347
METRIC RANK

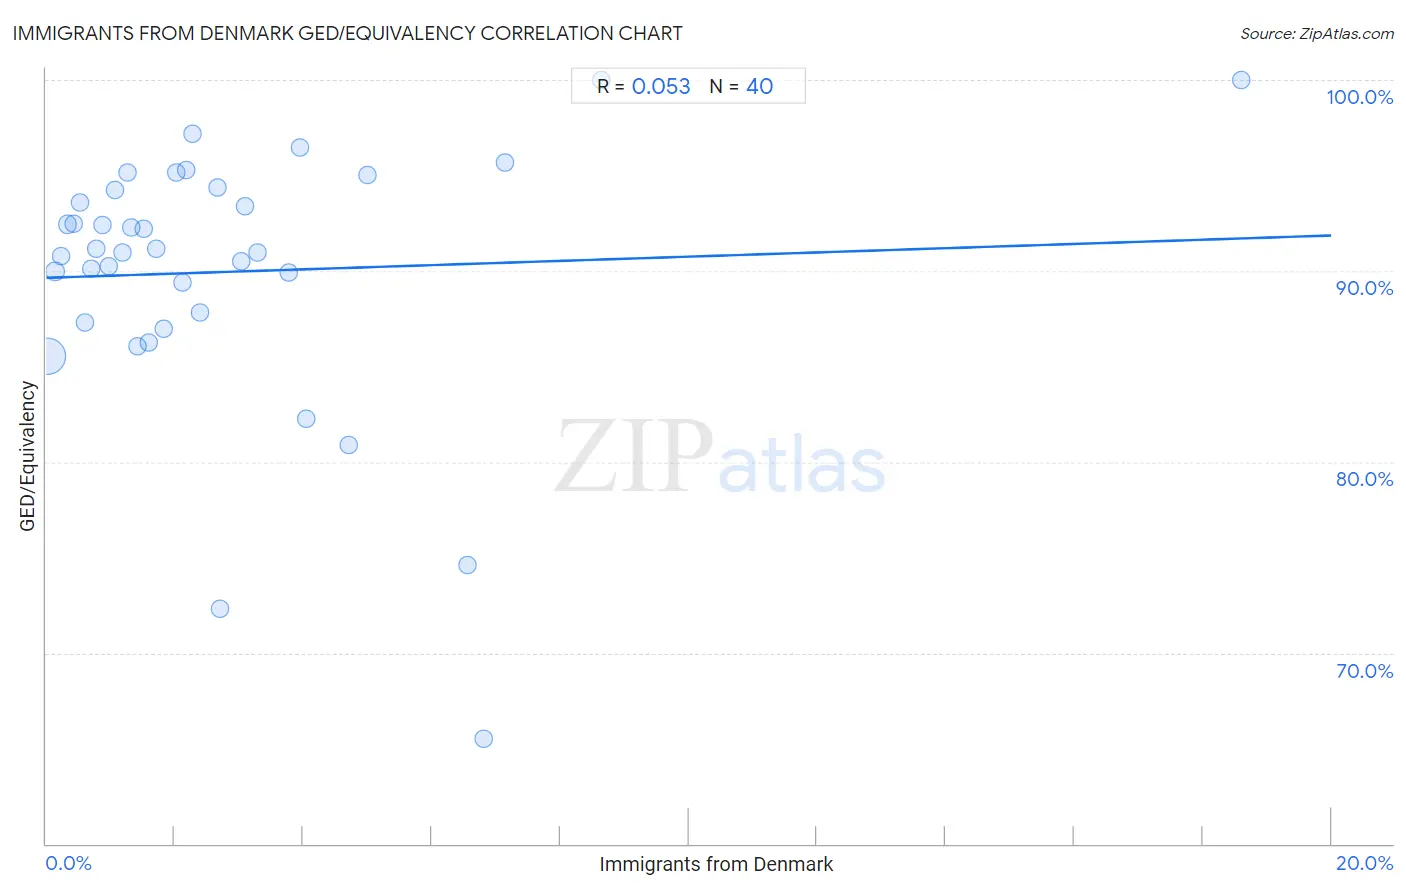
Immigrants from Denmark GED/Equivalency Correlation Chart

The statistical analysis conducted on geographies consisting of 136,430,715 people shows a slight positive correlation between the proportion of Immigrants from Denmark and percentage of population with at least ged/equivalency education in the United States with a correlation coefficient (R) of 0.053 and weighted average of 88.0%. On average, for every 1% (one percent) increase in Immigrants from Denmark within a typical geography, there is an increase of 0.11% in percentage of population with at least ged/equivalency education.
Immigrants from Denmark GED/Equivalency
It is essential to understand that the correlation between the percentage of Immigrants from Denmark and percentage of population with at least ged/equivalency education does not imply a direct cause-and-effect relationship. It remains uncertain whether the presence of Immigrants from Denmark influences an upward or downward trend in the level of percentage of population with at least ged/equivalency education within an area, or if Immigrants from Denmark simply ended up residing in those areas with higher or lower levels of percentage of population with at least ged/equivalency education due to other factors.

Demographics Similar to Immigrants from Denmark by GED/Equivalency

In terms of ged/equivalency, the demographic groups most similar to Immigrants from Denmark are Soviet Union (88.0%, a difference of 0.020%), New Zealander (88.0%, a difference of 0.020%), Immigrants from Netherlands (88.0%, a difference of 0.030%), Zimbabwean (88.0%, a difference of 0.030%), and Immigrants from South Africa (88.0%, a difference of 0.030%).
DemographicsRating | RankGED/Equivalency
Australians
99.5
/100
|
#49
Exceptional
88.1%
Immigrants from Korea
99.5
/100
|
#50
Exceptional
88.1%
Immigrants from Netherlands
99.4
/100
|
#51
Exceptional
88.0%
Zimbabweans
99.4
/100
|
#52
Exceptional
88.0%
Immigrants from South Africa
99.4
/100
|
#53
Exceptional
88.0%
Soviet Union
99.4
/100
|
#54
Exceptional
88.0%
New Zealanders
99.4
/100
|
#55
Exceptional
88.0%
Immigrants from Denmark
99.4
/100
|
#56
Exceptional
88.0%
Immigrants from Czechoslovakia
99.3
/100
|
#57
Exceptional
87.9%
Northern Europeans
99.3
/100
|
#58
Exceptional
87.9%
Serbians
99.3
/100
|
#59
Exceptional
87.9%
Scandinavians
99.3
/100
|
#60
Exceptional
87.9%
Europeans
99.3
/100
|
#61
Exceptional
87.9%
Germans
99.3
/100
|
#62
Exceptional
87.9%
Immigrants from Turkey
99.2
/100
|
#63
Exceptional
87.9%

Immigrants from Denmark GED/Equivalency Correlation Summary

MeasurementImmigrants from Denmark DataGED/Equivalency Data
Minimum0.022%65.5%
Maximum18.6%100.0%
Range18.6%34.5%
Mean2.8%90.0%
Median1.9%91.1%
Interquartile 25% (IQ1)0.92%87.6%
Interquartile 75% (IQ3)3.5%94.3%
Interquartile Range (IQR)2.6%6.7%
Standard Deviation (Sample)3.3%7.0%
Standard Deviation (Population)3.3%6.9%

Correlation Details

Immigrants from Denmark PercentileSample SizeGED/Equivalency
[
0.0%
-
0.5%
]
0.022%
125,394,53085.5%
[
0.0%
-
0.5%
]
0.13%
6,846,34890.0%
[
0.0%
-
0.5%
]
0.23%
2,349,15190.8%
[
0.0%
-
0.5%
]
0.32%
673,10992.4%
[
0.0%
-
0.5%
]
0.42%
363,99692.5%
[
0.5%
-
1.0%
]
0.52%
259,81593.6%
[
0.5%
-
1.0%
]
0.60%
247,66287.3%
[
0.5%
-
1.0%
]
0.69%
64,22690.1%
[
0.5%
-
1.0%
]
0.78%
27,81891.2%
[
0.5%
-
1.0%
]
0.88%
28,97192.4%
[
0.5%
-
1.0%
]
0.97%
17,78190.2%
[
1.0%
-
1.5%
]
1.07%
55,56694.3%
[
1.0%
-
1.5%
]
1.19%
6,66591.0%
[
1.0%
-
1.5%
]
1.27%
30,87195.1%
[
1.0%
-
1.5%
]
1.33%
8,33392.3%
[
1.0%
-
1.5%
]
1.43%
10,23386.1%
[
1.5%
-
2.0%
]
1.52%
11,23192.2%
[
1.5%
-
2.0%
]
1.60%
2,50586.3%
[
1.5%
-
2.0%
]
1.71%
8,11891.1%
[
1.5%
-
2.0%
]
1.84%
54487.0%
[
2.0%
-
2.5%
]
2.02%
9995.2%
[
2.0%
-
2.5%
]
2.13%
2,48989.4%
[
2.0%
-
2.5%
]
2.18%
1,37795.3%
[
2.0%
-
2.5%
]
2.28%
3,89697.2%
[
2.0%
-
2.5%
]
2.40%
2,21187.8%
[
2.5%
-
3.0%
]
2.67%
56194.4%
[
2.5%
-
3.0%
]
2.70%
29672.3%
[
3.0%
-
3.5%
]
3.03%
6690.5%
[
3.0%
-
3.5%
]
3.09%
3,74993.4%
[
3.0%
-
3.5%
]
3.28%
39690.9%
[
3.5%
-
4.0%
]
3.77%
2,04090.0%
[
3.5%
-
4.0%
]
3.94%
2,71496.5%
[
4.0%
-
4.5%
]
4.04%
9982.3%
[
4.5%
-
5.0%
]
4.70%
1,23380.9%
[
5.0%
-
5.5%
]
5.00%
4095.0%
[
6.5%
-
7.0%
]
6.56%
12274.6%
[
6.5%
-
7.0%
]
6.80%
1,13265.5%
[
7.0%
-
7.5%
]
7.14%
37895.7%
[
8.5%
-
9.0%
]
8.64%
301100.0%
[
18.5%
-
19.0%
]
18.60%
43100.0%