Malaysian Married-Couple Family Poverty
COMPARE
Malaysian
Select to Compare
Married-Couple Family Poverty
Malaysian Married-Couple Family Poverty
5.4%
POVERTY | MARRIED-COUPLE FAMILIES
29.5/ 100
METRIC RATING
193rd/ 347
METRIC RANK
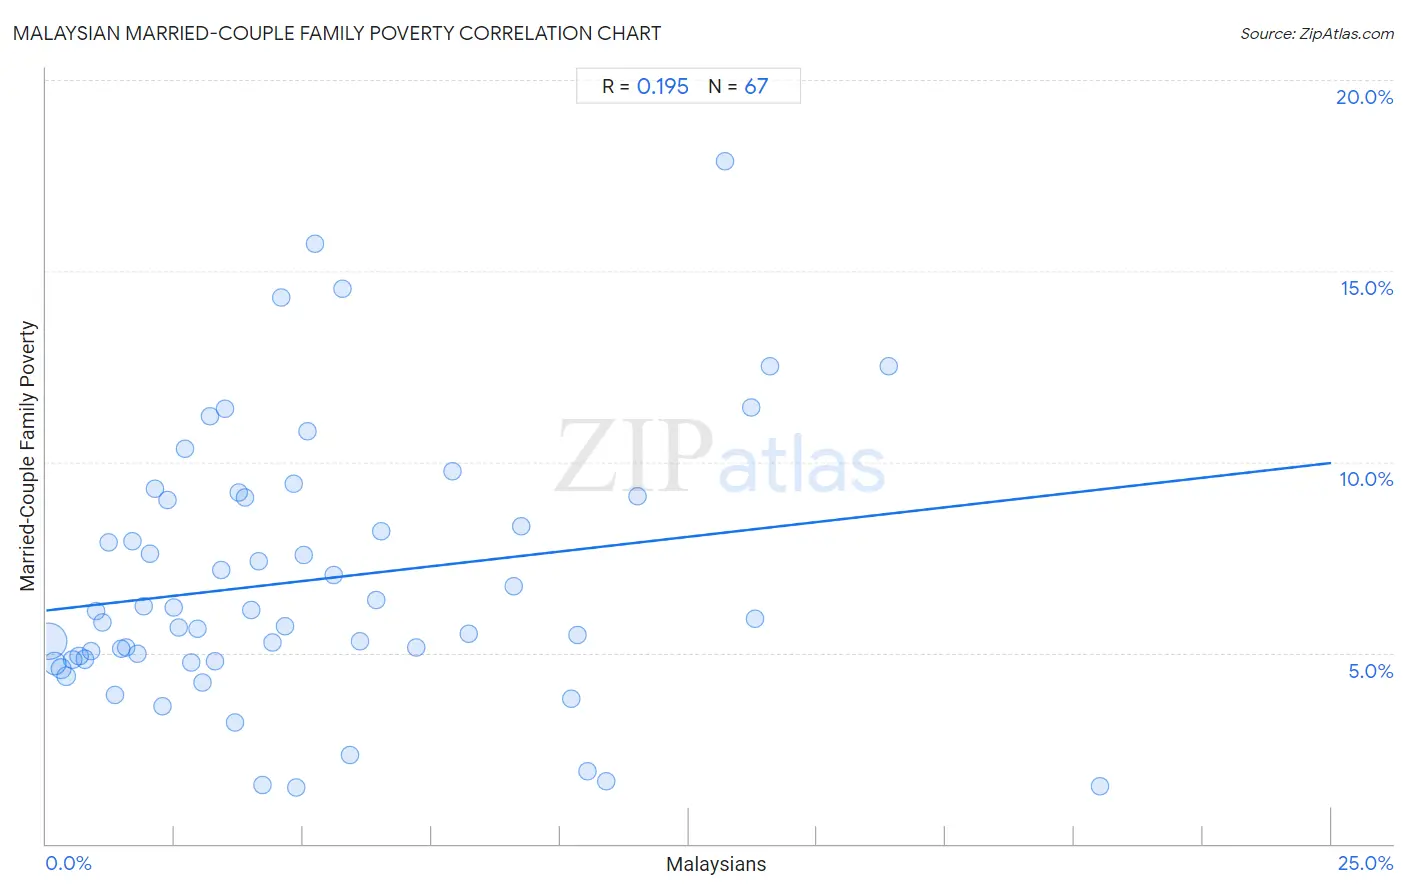
Malaysian Married-Couple Family Poverty Correlation Chart
The statistical analysis conducted on geographies consisting of 224,983,530 people shows a poor positive correlation between the proportion of Malaysians and poverty level among married-couple families in the United States with a correlation coefficient (R) of 0.195 and weighted average of 5.4%. On average, for every 1% (one percent) increase in Malaysians within a typical geography, there is an increase of 0.15% in poverty level among married-couple families.
It is essential to understand that the correlation between the percentage of Malaysians and poverty level among married-couple families does not imply a direct cause-and-effect relationship. It remains uncertain whether the presence of Malaysians influences an upward or downward trend in the level of poverty level among married-couple families within an area, or if Malaysians simply ended up residing in those areas with higher or lower levels of poverty level among married-couple families due to other factors.
Demographics Similar to Malaysians by Married-Couple Family Poverty
In terms of married-couple family poverty, the demographic groups most similar to Malaysians are Cape Verdean (5.3%, a difference of 0.17%), Immigrants from Cabo Verde (5.3%, a difference of 0.19%), Immigrants from Israel (5.4%, a difference of 0.22%), Immigrants from the Azores (5.4%, a difference of 0.27%), and Ugandan (5.3%, a difference of 0.29%).
| Demographics | Rating | Rank | Married-Couple Family Poverty |
| Hungarians | 34.7 /100 | #186 | Fair 5.3% |
| Immigrants from Albania | 33.8 /100 | #187 | Fair 5.3% |
| Israelis | 33.1 /100 | #188 | Fair 5.3% |
| South American Indians | 32.5 /100 | #189 | Fair 5.3% |
| Ugandans | 31.6 /100 | #190 | Fair 5.3% |
| Immigrants from Cabo Verde | 30.9 /100 | #191 | Fair 5.3% |
| Cape Verdeans | 30.7 /100 | #192 | Fair 5.3% |
| Malaysians | 29.5 /100 | #193 | Fair 5.4% |
| Immigrants from Israel | 27.8 /100 | #194 | Fair 5.4% |
| Immigrants from the Azores | 27.5 /100 | #195 | Fair 5.4% |
| Spaniards | 27.4 /100 | #196 | Fair 5.4% |
| Liberians | 26.3 /100 | #197 | Fair 5.4% |
| Immigrants from Belarus | 26.2 /100 | #198 | Fair 5.4% |
| Uruguayans | 25.0 /100 | #199 | Fair 5.4% |
| Immigrants from Morocco | 24.3 /100 | #200 | Fair 5.4% |
Malaysian Married-Couple Family Poverty Correlation Summary
| Measurement | Malaysian Data | Married-Couple Family Poverty Data |
| Minimum | 0.044% | 1.5% |
| Maximum | 20.5% | 17.9% |
| Range | 20.4% | 16.4% |
| Mean | 5.1% | 6.9% |
| Median | 3.9% | 5.9% |
| Interquartile 25% (IQ1) | 1.9% | 4.8% |
| Interquartile 75% (IQ3) | 6.5% | 9.1% |
| Interquartile Range (IQR) | 4.6% | 4.2% |
| Standard Deviation (Sample) | 4.4% | 3.5% |
| Standard Deviation (Population) | 4.3% | 3.4% |
Correlation Details
| Malaysian Percentile | Sample Size | Married-Couple Family Poverty |
[ 0.0% - 0.5% ] 0.044% | 133,949,743 | 5.3% |
[ 0.0% - 0.5% ] 0.17% | 38,800,702 | 4.7% |
[ 0.0% - 0.5% ] 0.28% | 19,014,316 | 4.6% |
[ 0.0% - 0.5% ] 0.39% | 9,157,661 | 4.4% |
[ 0.5% - 1.0% ] 0.52% | 6,591,965 | 4.8% |
[ 0.5% - 1.0% ] 0.64% | 3,551,745 | 4.9% |
[ 0.5% - 1.0% ] 0.74% | 2,368,374 | 4.8% |
[ 0.5% - 1.0% ] 0.87% | 1,914,245 | 5.0% |
[ 0.5% - 1.0% ] 0.97% | 2,163,287 | 6.1% |
[ 1.0% - 1.5% ] 1.09% | 847,983 | 5.8% |
[ 1.0% - 1.5% ] 1.21% | 1,554,078 | 7.9% |
[ 1.0% - 1.5% ] 1.34% | 867,307 | 3.9% |
[ 1.0% - 1.5% ] 1.45% | 445,663 | 5.1% |
[ 1.5% - 2.0% ] 1.55% | 601,423 | 5.1% |
[ 1.5% - 2.0% ] 1.67% | 750,467 | 7.9% |
[ 1.5% - 2.0% ] 1.78% | 287,887 | 5.0% |
[ 1.5% - 2.0% ] 1.89% | 269,925 | 6.2% |
[ 2.0% - 2.5% ] 2.02% | 200,033 | 7.6% |
[ 2.0% - 2.5% ] 2.11% | 270,476 | 9.3% |
[ 2.0% - 2.5% ] 2.26% | 93,828 | 3.6% |
[ 2.0% - 2.5% ] 2.36% | 188,385 | 9.0% |
[ 2.0% - 2.5% ] 2.48% | 210,482 | 6.2% |
[ 2.5% - 3.0% ] 2.58% | 110,870 | 5.7% |
[ 2.5% - 3.0% ] 2.71% | 42,764 | 10.3% |
[ 2.5% - 3.0% ] 2.83% | 160,470 | 4.7% |
[ 2.5% - 3.0% ] 2.94% | 189,095 | 5.6% |
[ 3.0% - 3.5% ] 3.03% | 102,188 | 4.2% |
[ 3.0% - 3.5% ] 3.20% | 27,756 | 11.2% |
[ 3.0% - 3.5% ] 3.28% | 43,282 | 4.8% |
[ 3.0% - 3.5% ] 3.41% | 3,282 | 7.2% |
[ 3.0% - 3.5% ] 3.47% | 27,020 | 11.4% |
[ 3.5% - 4.0% ] 3.67% | 14,884 | 3.2% |
[ 3.5% - 4.0% ] 3.75% | 32,829 | 9.2% |
[ 3.5% - 4.0% ] 3.86% | 18,516 | 9.1% |
[ 3.5% - 4.0% ] 3.99% | 1,605 | 6.1% |
[ 4.0% - 4.5% ] 4.14% | 1,955 | 7.4% |
[ 4.0% - 4.5% ] 4.20% | 1,857 | 1.5% |
[ 4.0% - 4.5% ] 4.41% | 3,927 | 5.3% |
[ 4.5% - 5.0% ] 4.58% | 18,993 | 14.3% |
[ 4.5% - 5.0% ] 4.64% | 2,845 | 5.7% |
[ 4.5% - 5.0% ] 4.82% | 2,262 | 9.4% |
[ 4.5% - 5.0% ] 4.86% | 5,408 | 1.5% |
[ 5.0% - 5.5% ] 5.01% | 3,695 | 7.6% |
[ 5.0% - 5.5% ] 5.09% | 2,063 | 10.8% |
[ 5.0% - 5.5% ] 5.23% | 5,484 | 15.7% |
[ 5.5% - 6.0% ] 5.59% | 1,574 | 7.0% |
[ 5.5% - 6.0% ] 5.78% | 1,316 | 14.5% |
[ 5.5% - 6.0% ] 5.91% | 8,465 | 2.3% |
[ 6.0% - 6.5% ] 6.10% | 541 | 5.3% |
[ 6.0% - 6.5% ] 6.42% | 4,001 | 6.4% |
[ 6.5% - 7.0% ] 6.52% | 3,005 | 8.2% |
[ 7.0% - 7.5% ] 7.19% | 153 | 5.1% |
[ 7.5% - 8.0% ] 7.91% | 278 | 9.8% |
[ 8.0% - 8.5% ] 8.21% | 15,355 | 5.5% |
[ 9.0% - 9.5% ] 9.10% | 13,838 | 6.7% |
[ 9.0% - 9.5% ] 9.24% | 1,407 | 8.3% |
[ 10.0% - 10.5% ] 10.21% | 2,595 | 3.8% |
[ 10.0% - 10.5% ] 10.34% | 861 | 5.5% |
[ 10.5% - 11.0% ] 10.54% | 389 | 1.9% |
[ 10.5% - 11.0% ] 10.90% | 991 | 1.7% |
[ 11.0% - 11.5% ] 11.49% | 87 | 9.1% |
[ 13.0% - 13.5% ] 13.21% | 106 | 17.9% |
[ 13.5% - 14.0% ] 13.71% | 2,984 | 11.4% |
[ 13.5% - 14.0% ] 13.79% | 1,900 | 5.9% |
[ 14.0% - 14.5% ] 14.08% | 71 | 12.5% |
[ 16.0% - 16.5% ] 16.39% | 61 | 12.5% |
[ 20.0% - 20.5% ] 20.49% | 527 | 1.5% |