Immigrants from Afghanistan Married-Couple Family Poverty
COMPARE
Immigrants from Afghanistan
Select to Compare
Married-Couple Family Poverty
Immigrants from Afghanistan Married-Couple Family Poverty
5.8%
POVERTY | MARRIED-COUPLE FAMILIES
2.1/ 100
METRIC RATING
245th/ 347
METRIC RANK
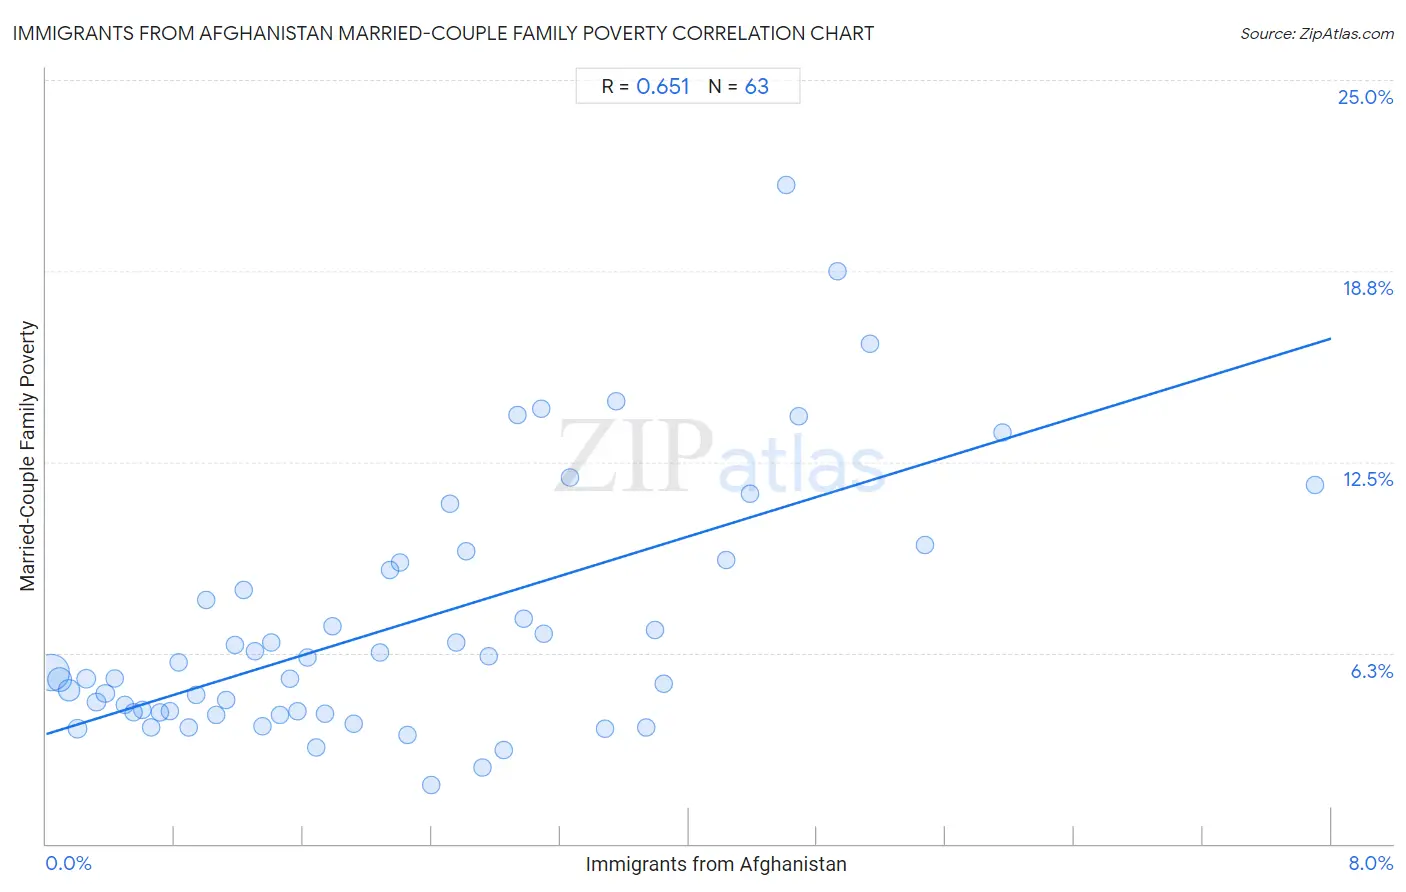
Immigrants from Afghanistan Married-Couple Family Poverty Correlation Chart
The statistical analysis conducted on geographies consisting of 147,133,206 people shows a significant positive correlation between the proportion of Immigrants from Afghanistan and poverty level among married-couple families in the United States with a correlation coefficient (R) of 0.651 and weighted average of 5.8%. On average, for every 1% (one percent) increase in Immigrants from Afghanistan within a typical geography, there is an increase of 1.6% in poverty level among married-couple families.
It is essential to understand that the correlation between the percentage of Immigrants from Afghanistan and poverty level among married-couple families does not imply a direct cause-and-effect relationship. It remains uncertain whether the presence of Immigrants from Afghanistan influences an upward or downward trend in the level of poverty level among married-couple families within an area, or if Immigrants from Afghanistan simply ended up residing in those areas with higher or lower levels of poverty level among married-couple families due to other factors.
Demographics Similar to Immigrants from Afghanistan by Married-Couple Family Poverty
In terms of married-couple family poverty, the demographic groups most similar to Immigrants from Afghanistan are Chickasaw (5.8%, a difference of 0.15%), Somali (5.8%, a difference of 0.16%), Immigrants from Western Africa (5.8%, a difference of 0.31%), Immigrants from Panama (5.8%, a difference of 0.40%), and Fijian (5.8%, a difference of 0.43%).
| Demographics | Rating | Rank | Married-Couple Family Poverty |
| Cherokee | 2.7 /100 | #238 | Tragic 5.8% |
| Venezuelans | 2.7 /100 | #239 | Tragic 5.8% |
| Fijians | 2.5 /100 | #240 | Tragic 5.8% |
| Immigrants from Panama | 2.5 /100 | #241 | Tragic 5.8% |
| Immigrants from Western Africa | 2.4 /100 | #242 | Tragic 5.8% |
| Somalis | 2.3 /100 | #243 | Tragic 5.8% |
| Chickasaw | 2.3 /100 | #244 | Tragic 5.8% |
| Immigrants from Afghanistan | 2.1 /100 | #245 | Tragic 5.8% |
| Immigrants from Venezuela | 1.8 /100 | #246 | Tragic 5.8% |
| Iraqis | 1.4 /100 | #247 | Tragic 5.9% |
| Cree | 1.2 /100 | #248 | Tragic 5.9% |
| Tsimshian | 1.1 /100 | #249 | Tragic 5.9% |
| Immigrants from Eritrea | 1.1 /100 | #250 | Tragic 5.9% |
| Immigrants from Ghana | 1.0 /100 | #251 | Tragic 5.9% |
| Immigrants from Western Asia | 0.7 /100 | #252 | Tragic 6.0% |
Immigrants from Afghanistan Married-Couple Family Poverty Correlation Summary
| Measurement | Immigrants from Afghanistan Data | Married-Couple Family Poverty Data |
| Minimum | 0.029% | 1.9% |
| Maximum | 7.9% | 21.6% |
| Range | 7.9% | 19.6% |
| Mean | 2.2% | 7.2% |
| Median | 1.8% | 5.6% |
| Interquartile 25% (IQ1) | 0.89% | 4.3% |
| Interquartile 75% (IQ3) | 3.1% | 9.2% |
| Interquartile Range (IQR) | 2.2% | 4.9% |
| Standard Deviation (Sample) | 1.7% | 4.1% |
| Standard Deviation (Population) | 1.7% | 4.1% |
Correlation Details
| Immigrants from Afghanistan Percentile | Sample Size | Married-Couple Family Poverty |
[ 0.0% - 0.5% ] 0.029% | 75,057,242 | 5.6% |
[ 0.0% - 0.5% ] 0.083% | 28,100,713 | 5.4% |
[ 0.0% - 0.5% ] 0.14% | 12,699,423 | 5.0% |
[ 0.0% - 0.5% ] 0.20% | 5,272,798 | 3.8% |
[ 0.0% - 0.5% ] 0.25% | 4,988,899 | 5.4% |
[ 0.0% - 0.5% ] 0.31% | 3,182,593 | 4.6% |
[ 0.0% - 0.5% ] 0.37% | 2,332,160 | 4.9% |
[ 0.0% - 0.5% ] 0.43% | 2,133,368 | 5.4% |
[ 0.0% - 0.5% ] 0.49% | 1,393,837 | 4.5% |
[ 0.5% - 1.0% ] 0.54% | 1,570,017 | 4.3% |
[ 0.5% - 1.0% ] 0.60% | 774,937 | 4.4% |
[ 0.5% - 1.0% ] 0.66% | 785,853 | 3.8% |
[ 0.5% - 1.0% ] 0.71% | 854,084 | 4.3% |
[ 0.5% - 1.0% ] 0.77% | 915,237 | 4.3% |
[ 0.5% - 1.0% ] 0.82% | 915,222 | 5.9% |
[ 0.5% - 1.0% ] 0.89% | 276,819 | 3.8% |
[ 0.5% - 1.0% ] 0.93% | 690,797 | 4.9% |
[ 0.5% - 1.0% ] 0.99% | 515,782 | 8.0% |
[ 1.0% - 1.5% ] 1.06% | 577,674 | 4.2% |
[ 1.0% - 1.5% ] 1.12% | 363,203 | 4.7% |
[ 1.0% - 1.5% ] 1.18% | 560,455 | 6.5% |
[ 1.0% - 1.5% ] 1.23% | 187,193 | 8.3% |
[ 1.0% - 1.5% ] 1.30% | 289,727 | 6.3% |
[ 1.0% - 1.5% ] 1.35% | 177,016 | 3.8% |
[ 1.0% - 1.5% ] 1.40% | 182,752 | 6.6% |
[ 1.0% - 1.5% ] 1.45% | 151,439 | 4.2% |
[ 1.5% - 2.0% ] 1.52% | 162,757 | 5.4% |
[ 1.5% - 2.0% ] 1.56% | 158,976 | 4.3% |
[ 1.5% - 2.0% ] 1.62% | 149,493 | 6.1% |
[ 1.5% - 2.0% ] 1.68% | 154,351 | 3.2% |
[ 1.5% - 2.0% ] 1.74% | 153,547 | 4.2% |
[ 1.5% - 2.0% ] 1.78% | 85,523 | 7.1% |
[ 1.5% - 2.0% ] 1.91% | 161,077 | 3.9% |
[ 2.0% - 2.5% ] 2.08% | 127,855 | 6.3% |
[ 2.0% - 2.5% ] 2.14% | 85,679 | 8.9% |
[ 2.0% - 2.5% ] 2.20% | 29,846 | 9.2% |
[ 2.0% - 2.5% ] 2.25% | 90,052 | 3.6% |
[ 2.0% - 2.5% ] 2.40% | 5,416 | 1.9% |
[ 2.5% - 3.0% ] 2.51% | 36,335 | 11.1% |
[ 2.5% - 3.0% ] 2.55% | 63,715 | 6.6% |
[ 2.5% - 3.0% ] 2.61% | 51,346 | 9.6% |
[ 2.5% - 3.0% ] 2.72% | 1,620 | 2.5% |
[ 2.5% - 3.0% ] 2.76% | 56,476 | 6.1% |
[ 2.5% - 3.0% ] 2.85% | 45,296 | 3.1% |
[ 2.5% - 3.0% ] 2.93% | 23,756 | 14.0% |
[ 2.5% - 3.0% ] 2.97% | 19,531 | 7.3% |
[ 3.0% - 3.5% ] 3.09% | 35,458 | 14.3% |
[ 3.0% - 3.5% ] 3.10% | 1,936 | 6.9% |
[ 3.0% - 3.5% ] 3.26% | 48,083 | 12.0% |
[ 3.0% - 3.5% ] 3.48% | 10,400 | 3.8% |
[ 3.5% - 4.0% ] 3.55% | 18,080 | 14.5% |
[ 3.5% - 4.0% ] 3.73% | 7,770 | 3.8% |
[ 3.5% - 4.0% ] 3.79% | 39,126 | 7.0% |
[ 3.5% - 4.0% ] 3.85% | 12,840 | 5.3% |
[ 4.0% - 4.5% ] 4.23% | 37,635 | 9.3% |
[ 4.0% - 4.5% ] 4.38% | 63,907 | 11.4% |
[ 4.5% - 5.0% ] 4.61% | 16,050 | 21.6% |
[ 4.5% - 5.0% ] 4.69% | 37,310 | 14.0% |
[ 4.5% - 5.0% ] 4.93% | 345 | 18.8% |
[ 5.0% - 5.5% ] 5.13% | 24,785 | 16.4% |
[ 5.0% - 5.5% ] 5.47% | 96,076 | 9.8% |
[ 5.5% - 6.0% ] 5.95% | 34,082 | 13.5% |
[ 7.5% - 8.0% ] 7.90% | 37,436 | 11.7% |