Immigrants from Latin America Married-Couple Family Poverty
COMPARE
Immigrants from Latin America
Select to Compare
Married-Couple Family Poverty
Immigrants from Latin America Married-Couple Family Poverty
7.2%
POVERTY | MARRIED-COUPLE FAMILIES
0.0/ 100
METRIC RATING
319th/ 347
METRIC RANK
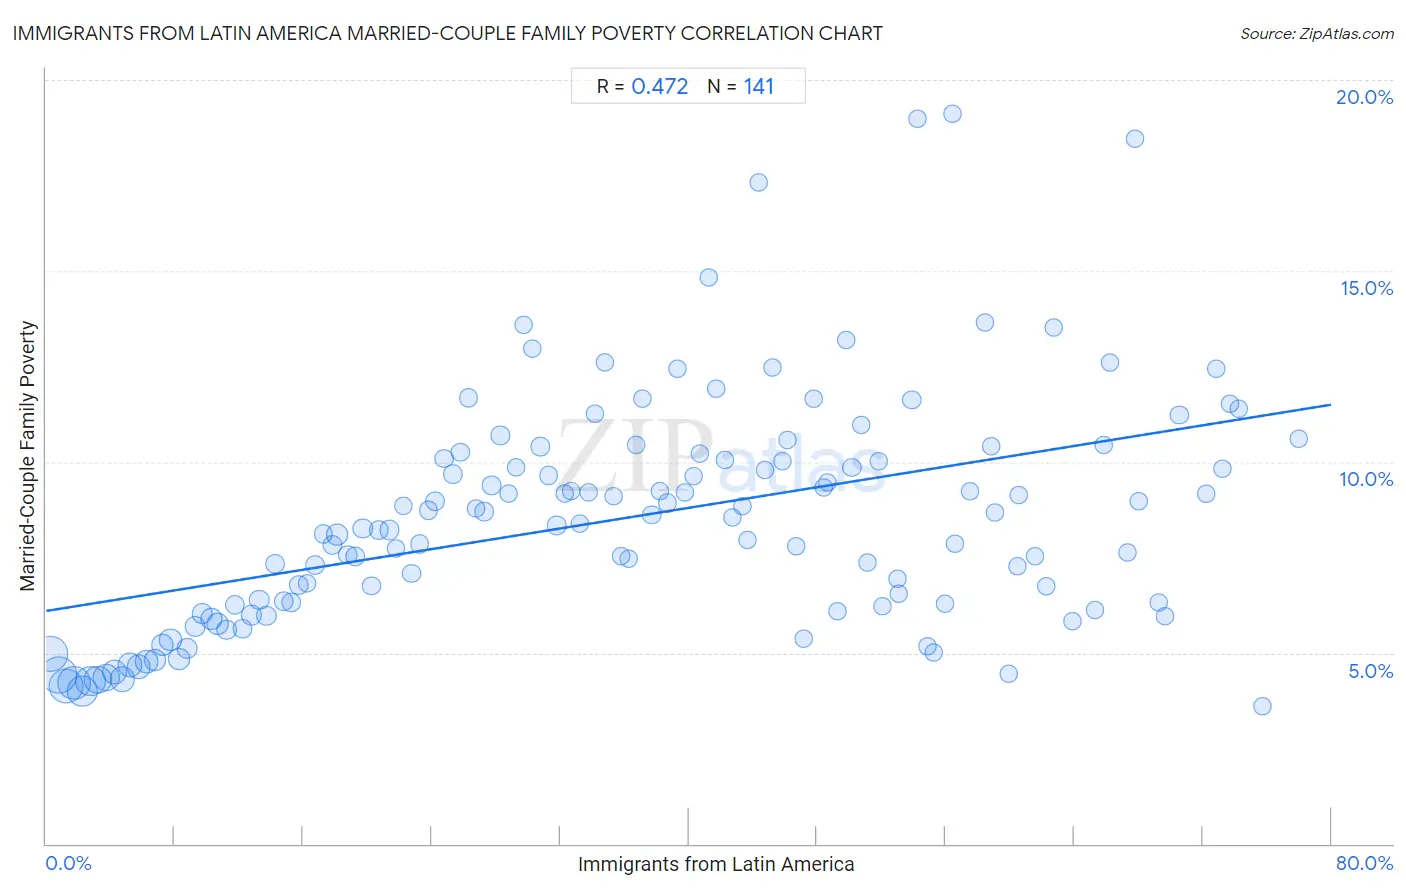
Immigrants from Latin America Married-Couple Family Poverty Correlation Chart
The statistical analysis conducted on geographies consisting of 546,700,324 people shows a moderate positive correlation between the proportion of Immigrants from Latin America and poverty level among married-couple families in the United States with a correlation coefficient (R) of 0.472 and weighted average of 7.2%. On average, for every 1% (one percent) increase in Immigrants from Latin America within a typical geography, there is an increase of 0.067% in poverty level among married-couple families.
It is essential to understand that the correlation between the percentage of Immigrants from Latin America and poverty level among married-couple families does not imply a direct cause-and-effect relationship. It remains uncertain whether the presence of Immigrants from Latin America influences an upward or downward trend in the level of poverty level among married-couple families within an area, or if Immigrants from Latin America simply ended up residing in those areas with higher or lower levels of poverty level among married-couple families due to other factors.
Demographics Similar to Immigrants from Latin America by Married-Couple Family Poverty
In terms of married-couple family poverty, the demographic groups most similar to Immigrants from Latin America are Immigrants from Guatemala (7.2%, a difference of 0.17%), Mexican (7.2%, a difference of 0.34%), Honduran (7.2%, a difference of 0.65%), Inupiat (7.1%, a difference of 0.81%), and British West Indian (7.1%, a difference of 1.1%).
| Demographics | Rating | Rank | Married-Couple Family Poverty |
| Immigrants from Armenia | 0.0 /100 | #312 | Tragic 7.1% |
| Immigrants from St. Vincent and the Grenadines | 0.0 /100 | #313 | Tragic 7.1% |
| British West Indians | 0.0 /100 | #314 | Tragic 7.1% |
| Inupiat | 0.0 /100 | #315 | Tragic 7.1% |
| Hondurans | 0.0 /100 | #316 | Tragic 7.2% |
| Mexicans | 0.0 /100 | #317 | Tragic 7.2% |
| Immigrants from Guatemala | 0.0 /100 | #318 | Tragic 7.2% |
| Immigrants from Latin America | 0.0 /100 | #319 | Tragic 7.2% |
| Immigrants from Grenada | 0.0 /100 | #320 | Tragic 7.3% |
| Immigrants from Caribbean | 0.0 /100 | #321 | Tragic 7.3% |
| Immigrants from Honduras | 0.0 /100 | #322 | Tragic 7.3% |
| Vietnamese | 0.0 /100 | #323 | Tragic 7.4% |
| Immigrants from Central America | 0.0 /100 | #324 | Tragic 7.4% |
| Immigrants from Cuba | 0.0 /100 | #325 | Tragic 7.5% |
| Immigrants from Bangladesh | 0.0 /100 | #326 | Tragic 7.5% |
Immigrants from Latin America Married-Couple Family Poverty Correlation Summary
| Measurement | Immigrants from Latin America Data | Married-Couple Family Poverty Data |
| Minimum | 0.27% | 3.6% |
| Maximum | 78.0% | 19.1% |
| Range | 77.7% | 15.5% |
| Mean | 35.8% | 8.5% |
| Median | 35.3% | 8.3% |
| Interquartile 25% (IQ1) | 17.5% | 6.2% |
| Interquartile 75% (IQ3) | 53.0% | 10.1% |
| Interquartile Range (IQR) | 35.5% | 3.9% |
| Standard Deviation (Sample) | 21.3% | 3.0% |
| Standard Deviation (Population) | 21.2% | 3.0% |
Correlation Details
| Immigrants from Latin America Percentile | Sample Size | Married-Couple Family Poverty |
[ 0.0% - 0.5% ] 0.27% | 43,145,850 | 5.0% |
[ 0.5% - 1.0% ] 0.75% | 46,896,691 | 4.4% |
[ 1.0% - 1.5% ] 1.24% | 41,717,804 | 4.1% |
[ 1.5% - 2.0% ] 1.75% | 35,708,193 | 4.2% |
[ 2.0% - 2.5% ] 2.25% | 31,902,787 | 4.0% |
[ 2.5% - 3.0% ] 2.75% | 28,862,162 | 4.3% |
[ 3.0% - 3.5% ] 3.22% | 23,293,790 | 4.3% |
[ 3.5% - 4.0% ] 3.75% | 21,919,487 | 4.4% |
[ 4.0% - 4.5% ] 4.25% | 18,144,934 | 4.5% |
[ 4.5% - 5.0% ] 4.75% | 16,510,279 | 4.3% |
[ 5.0% - 5.5% ] 5.23% | 15,878,101 | 4.7% |
[ 5.5% - 6.0% ] 5.74% | 12,805,098 | 4.6% |
[ 6.0% - 6.5% ] 6.24% | 10,666,164 | 4.8% |
[ 6.5% - 7.0% ] 6.74% | 9,424,693 | 4.8% |
[ 7.0% - 7.5% ] 7.24% | 9,910,614 | 5.2% |
[ 7.5% - 8.0% ] 7.74% | 10,021,174 | 5.3% |
[ 8.0% - 8.5% ] 8.26% | 7,997,168 | 4.8% |
[ 8.5% - 9.0% ] 8.78% | 7,947,844 | 5.1% |
[ 9.0% - 9.5% ] 9.25% | 5,364,364 | 5.7% |
[ 9.5% - 10.0% ] 9.71% | 7,191,125 | 6.0% |
[ 10.0% - 10.5% ] 10.29% | 8,790,544 | 5.9% |
[ 10.5% - 11.0% ] 10.68% | 8,865,845 | 5.7% |
[ 11.0% - 11.5% ] 11.23% | 4,282,358 | 5.6% |
[ 11.5% - 12.0% ] 11.77% | 3,761,318 | 6.3% |
[ 12.0% - 12.5% ] 12.23% | 3,097,596 | 5.6% |
[ 12.5% - 13.0% ] 12.77% | 5,389,165 | 6.0% |
[ 13.0% - 13.5% ] 13.25% | 3,786,424 | 6.4% |
[ 13.5% - 14.0% ] 13.70% | 5,367,022 | 6.0% |
[ 14.0% - 14.5% ] 14.25% | 2,756,297 | 7.3% |
[ 14.5% - 15.0% ] 14.77% | 3,164,886 | 6.3% |
[ 15.0% - 15.5% ] 15.26% | 3,394,498 | 6.3% |
[ 15.5% - 16.0% ] 15.72% | 2,853,817 | 6.8% |
[ 16.0% - 16.5% ] 16.24% | 2,110,232 | 6.8% |
[ 16.5% - 17.0% ] 16.74% | 2,912,244 | 7.3% |
[ 17.0% - 17.5% ] 17.24% | 2,108,120 | 8.1% |
[ 17.5% - 18.0% ] 17.80% | 3,340,767 | 7.8% |
[ 18.0% - 18.5% ] 18.12% | 11,256,264 | 8.1% |
[ 18.5% - 19.0% ] 18.78% | 2,052,678 | 7.6% |
[ 19.0% - 19.5% ] 19.24% | 2,192,656 | 7.5% |
[ 19.5% - 20.0% ] 19.71% | 4,690,857 | 8.3% |
[ 20.0% - 20.5% ] 20.25% | 2,014,778 | 6.8% |
[ 20.5% - 21.0% ] 20.71% | 2,709,322 | 8.2% |
[ 21.0% - 21.5% ] 21.37% | 5,946,517 | 8.2% |
[ 21.5% - 22.0% ] 21.77% | 1,371,594 | 7.7% |
[ 22.0% - 22.5% ] 22.24% | 1,981,577 | 8.8% |
[ 22.5% - 23.0% ] 22.74% | 1,572,696 | 7.1% |
[ 23.0% - 23.5% ] 23.24% | 1,810,278 | 7.8% |
[ 23.5% - 24.0% ] 23.78% | 1,471,047 | 8.7% |
[ 24.0% - 24.5% ] 24.24% | 2,949,987 | 9.0% |
[ 24.5% - 25.0% ] 24.76% | 1,179,413 | 10.1% |
[ 25.0% - 25.5% ] 25.31% | 1,246,408 | 9.7% |
[ 25.5% - 26.0% ] 25.77% | 1,393,982 | 10.3% |
[ 26.0% - 26.5% ] 26.30% | 1,351,822 | 11.7% |
[ 26.5% - 27.0% ] 26.74% | 1,200,283 | 8.8% |
[ 27.0% - 27.5% ] 27.25% | 1,193,358 | 8.7% |
[ 27.5% - 28.0% ] 27.73% | 1,380,955 | 9.4% |
[ 28.0% - 28.5% ] 28.29% | 1,050,317 | 10.7% |
[ 28.5% - 29.0% ] 28.79% | 964,470 | 9.2% |
[ 29.0% - 29.5% ] 29.27% | 835,856 | 9.9% |
[ 29.5% - 30.0% ] 29.74% | 774,648 | 13.6% |
[ 30.0% - 30.5% ] 30.25% | 872,637 | 13.0% |
[ 30.5% - 31.0% ] 30.76% | 1,325,979 | 10.4% |
[ 31.0% - 31.5% ] 31.26% | 834,470 | 9.6% |
[ 31.5% - 32.0% ] 31.78% | 752,975 | 8.3% |
[ 32.0% - 32.5% ] 32.30% | 1,086,249 | 9.2% |
[ 32.5% - 33.0% ] 32.70% | 854,427 | 9.2% |
[ 33.0% - 33.5% ] 33.25% | 673,292 | 8.4% |
[ 33.5% - 34.0% ] 33.75% | 622,172 | 9.2% |
[ 34.0% - 34.5% ] 34.19% | 357,674 | 11.3% |
[ 34.5% - 35.0% ] 34.77% | 709,587 | 12.6% |
[ 35.0% - 35.5% ] 35.31% | 494,433 | 9.1% |
[ 35.5% - 36.0% ] 35.81% | 725,366 | 7.5% |
[ 36.0% - 36.5% ] 36.23% | 318,461 | 7.5% |
[ 36.5% - 37.0% ] 36.71% | 448,607 | 10.4% |
[ 37.0% - 37.5% ] 37.13% | 504,124 | 11.7% |
[ 37.5% - 38.0% ] 37.70% | 693,195 | 8.6% |
[ 38.0% - 38.5% ] 38.22% | 506,131 | 9.2% |
[ 38.5% - 39.0% ] 38.69% | 508,344 | 8.9% |
[ 39.0% - 39.5% ] 39.27% | 289,834 | 12.4% |
[ 39.5% - 40.0% ] 39.77% | 409,582 | 9.2% |
[ 40.0% - 40.5% ] 40.27% | 520,877 | 9.6% |
[ 40.5% - 41.0% ] 40.67% | 735,494 | 10.2% |
[ 41.0% - 41.5% ] 41.21% | 176,035 | 14.8% |
[ 41.5% - 42.0% ] 41.73% | 166,257 | 11.9% |
[ 42.0% - 42.5% ] 42.24% | 434,835 | 10.1% |
[ 42.5% - 43.0% ] 42.73% | 418,373 | 8.6% |
[ 43.0% - 43.5% ] 43.31% | 238,058 | 8.8% |
[ 43.5% - 44.0% ] 43.69% | 201,043 | 7.9% |
[ 44.0% - 44.5% ] 44.34% | 328,097 | 17.3% |
[ 44.5% - 45.0% ] 44.72% | 288,811 | 9.8% |
[ 45.0% - 45.5% ] 45.24% | 127,862 | 12.5% |
[ 45.5% - 46.0% ] 45.85% | 171,553 | 10.0% |
[ 46.0% - 46.5% ] 46.17% | 105,637 | 10.6% |
[ 46.5% - 47.0% ] 46.72% | 222,758 | 7.8% |
[ 47.0% - 47.5% ] 47.16% | 201,590 | 5.4% |
[ 47.5% - 48.0% ] 47.81% | 156,830 | 11.7% |
[ 48.0% - 48.5% ] 48.38% | 48,361 | 9.3% |
[ 48.5% - 49.0% ] 48.65% | 270,648 | 9.5% |
[ 49.0% - 49.5% ] 49.22% | 96,524 | 6.1% |
[ 49.5% - 50.0% ] 49.81% | 249,542 | 13.2% |
[ 50.0% - 50.5% ] 50.15% | 86,921 | 9.9% |
[ 50.5% - 51.0% ] 50.72% | 111,398 | 11.0% |
[ 51.0% - 51.5% ] 51.11% | 21,106 | 7.4% |
[ 51.5% - 52.0% ] 51.81% | 133,160 | 10.0% |
[ 52.0% - 52.5% ] 52.07% | 45,438 | 6.2% |
[ 52.5% - 53.0% ] 52.98% | 13,877 | 6.9% |
[ 53.0% - 53.5% ] 53.10% | 55,370 | 6.6% |
[ 53.5% - 54.0% ] 53.89% | 443,715 | 11.6% |
[ 54.0% - 54.5% ] 54.26% | 34,876 | 19.0% |
[ 54.5% - 55.0% ] 54.90% | 37,977 | 5.2% |
[ 55.0% - 55.5% ] 55.24% | 13,854 | 5.0% |
[ 55.5% - 56.0% ] 55.93% | 55,604 | 6.3% |
[ 56.0% - 56.5% ] 56.43% | 14,541 | 19.1% |
[ 56.5% - 57.0% ] 56.59% | 68,833 | 7.8% |
[ 57.0% - 57.5% ] 57.49% | 7,104 | 9.2% |
[ 58.0% - 58.5% ] 58.48% | 26,073 | 13.7% |
[ 58.5% - 59.0% ] 58.83% | 6,313 | 10.4% |
[ 59.0% - 59.5% ] 59.08% | 50,975 | 8.7% |
[ 59.5% - 60.0% ] 59.91% | 94,621 | 4.5% |
[ 60.0% - 60.5% ] 60.45% | 24,597 | 7.3% |
[ 60.5% - 61.0% ] 60.52% | 83,916 | 9.1% |
[ 61.5% - 62.0% ] 61.54% | 10,725 | 7.5% |
[ 62.0% - 62.5% ] 62.24% | 108,096 | 6.8% |
[ 62.5% - 63.0% ] 62.70% | 13,163 | 13.5% |
[ 63.5% - 64.0% ] 63.90% | 167,279 | 5.8% |
[ 65.0% - 65.5% ] 65.32% | 109,226 | 6.1% |
[ 65.5% - 66.0% ] 65.81% | 52,851 | 10.5% |
[ 66.0% - 66.5% ] 66.26% | 44,595 | 12.6% |
[ 67.0% - 67.5% ] 67.28% | 40,406 | 7.6% |
[ 67.5% - 68.0% ] 67.74% | 54,873 | 18.5% |
[ 68.0% - 68.5% ] 68.02% | 20,850 | 9.0% |
[ 69.0% - 69.5% ] 69.27% | 26,596 | 6.3% |
[ 69.5% - 70.0% ] 69.67% | 57,066 | 6.0% |
[ 70.5% - 71.0% ] 70.54% | 68,435 | 11.2% |
[ 72.0% - 72.5% ] 72.20% | 19,399 | 9.2% |
[ 72.5% - 73.0% ] 72.82% | 64,572 | 12.4% |
[ 73.0% - 73.5% ] 73.24% | 222,996 | 9.8% |
[ 73.5% - 74.0% ] 73.72% | 46,798 | 11.5% |
[ 74.0% - 74.5% ] 74.26% | 71,088 | 11.4% |
[ 75.5% - 76.0% ] 75.74% | 1,018 | 3.6% |
[ 78.0% - 78.5% ] 78.01% | 42,081 | 10.6% |