South American Married-Couple Family Poverty
COMPARE
South American
Select to Compare
Married-Couple Family Poverty
South American Married-Couple Family Poverty
5.6%
POVERTY | MARRIED-COUPLE FAMILIES
5.7/ 100
METRIC RATING
226th/ 347
METRIC RANK
South American Married-Couple Family Poverty Correlation Chart
The statistical analysis conducted on geographies consisting of 487,269,778 people shows a poor positive correlation between the proportion of South Americans and poverty level among married-couple families in the United States with a correlation coefficient (R) of 0.172 and weighted average of 5.6%. On average, for every 1% (one percent) increase in South Americans within a typical geography, there is an increase of 0.033% in poverty level among married-couple families.
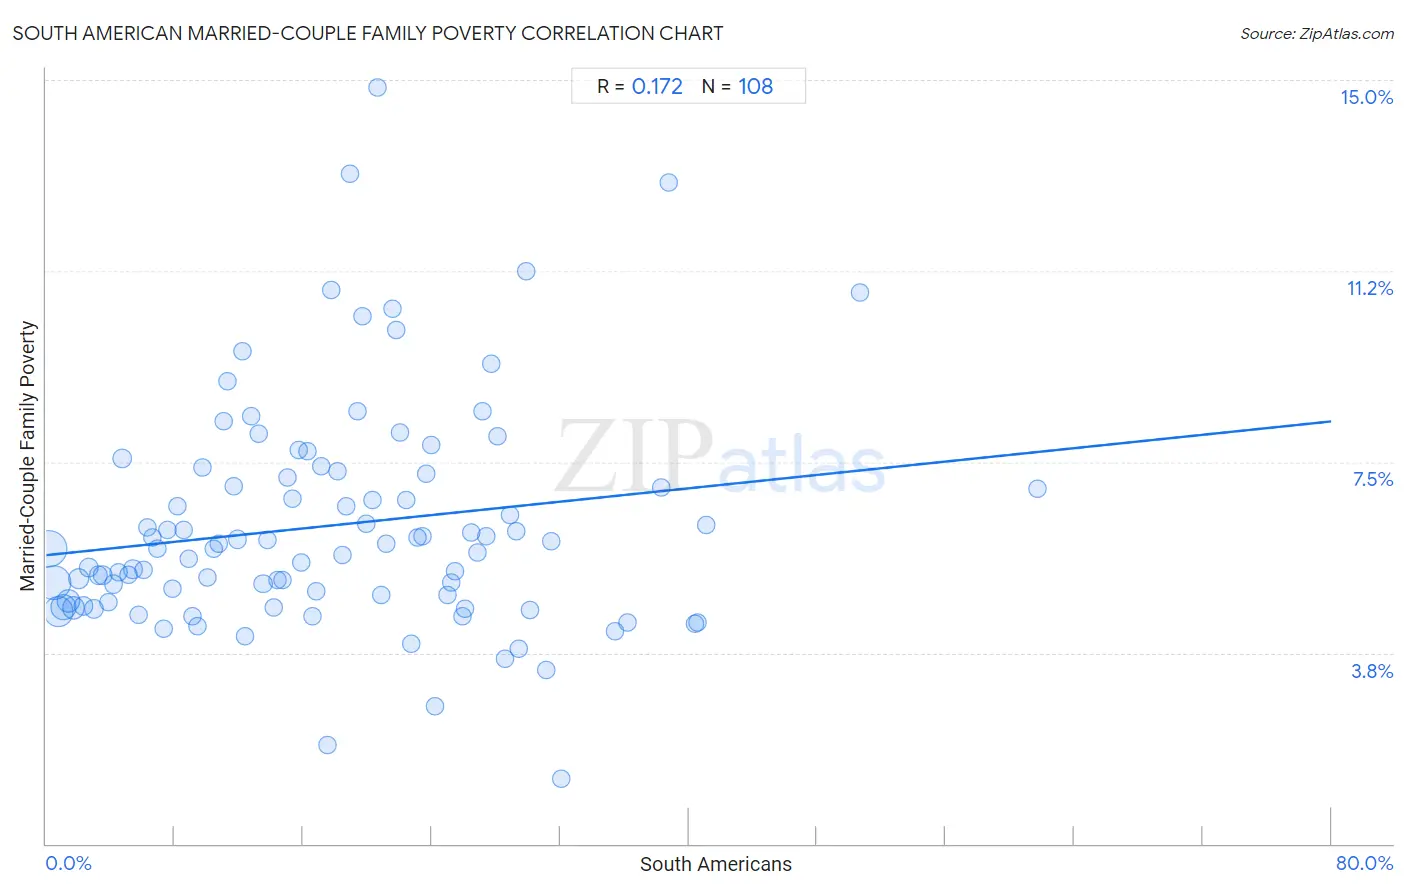
It is essential to understand that the correlation between the percentage of South Americans and poverty level among married-couple families does not imply a direct cause-and-effect relationship. It remains uncertain whether the presence of South Americans influences an upward or downward trend in the level of poverty level among married-couple families within an area, or if South Americans simply ended up residing in those areas with higher or lower levels of poverty level among married-couple families due to other factors.
Demographics Similar to South Americans by Married-Couple Family Poverty
In terms of married-couple family poverty, the demographic groups most similar to South Americans are Immigrants from Zaire (5.6%, a difference of 0.020%), Arab (5.7%, a difference of 0.15%), Immigrants from Cambodia (5.6%, a difference of 0.22%), Sudanese (5.6%, a difference of 0.37%), and Subsaharan African (5.7%, a difference of 0.40%).
| Demographics | Rating | Rank | Married-Couple Family Poverty |
| Japanese | 9.8 /100 | #219 | Tragic 5.6% |
| Colombians | 9.2 /100 | #220 | Tragic 5.6% |
| Panamanians | 9.2 /100 | #221 | Tragic 5.6% |
| Cajuns | 6.9 /100 | #222 | Tragic 5.6% |
| Immigrants from Fiji | 6.7 /100 | #223 | Tragic 5.6% |
| Sudanese | 6.4 /100 | #224 | Tragic 5.6% |
| Immigrants from Cambodia | 6.1 /100 | #225 | Tragic 5.6% |
| South Americans | 5.7 /100 | #226 | Tragic 5.6% |
| Immigrants from Zaire | 5.6 /100 | #227 | Tragic 5.6% |
| Arabs | 5.4 /100 | #228 | Tragic 5.7% |
| Sub-Saharan Africans | 4.9 /100 | #229 | Tragic 5.7% |
| Moroccans | 4.9 /100 | #230 | Tragic 5.7% |
| Immigrants from Iraq | 4.4 /100 | #231 | Tragic 5.7% |
| Immigrants from Laos | 4.4 /100 | #232 | Tragic 5.7% |
| Immigrants from Colombia | 3.7 /100 | #233 | Tragic 5.7% |
South American Married-Couple Family Poverty Correlation Summary
| Measurement | South American Data | Married-Couple Family Poverty Data |
| Minimum | 0.16% | 1.3% |
| Maximum | 61.7% | 14.8% |
| Range | 61.6% | 13.6% |
| Mean | 17.7% | 6.2% |
| Median | 16.7% | 5.8% |
| Interquartile 25% (IQ1) | 8.4% | 4.8% |
| Interquartile 75% (IQ3) | 25.3% | 7.2% |
| Interquartile Range (IQR) | 17.0% | 2.5% |
| Standard Deviation (Sample) | 11.7% | 2.2% |
| Standard Deviation (Population) | 11.7% | 2.2% |
Correlation Details
| South American Percentile | Sample Size | Married-Couple Family Poverty |
[ 0.0% - 0.5% ] 0.16% | 113,236,066 | 5.8% |
[ 0.0% - 0.5% ] 0.46% | 96,151,618 | 5.1% |
[ 0.5% - 1.0% ] 0.76% | 71,415,988 | 4.6% |
[ 1.0% - 1.5% ] 1.08% | 49,057,902 | 4.6% |
[ 1.0% - 1.5% ] 1.39% | 33,749,412 | 4.8% |
[ 1.5% - 2.0% ] 1.70% | 25,688,154 | 4.6% |
[ 2.0% - 2.5% ] 2.01% | 15,925,854 | 5.2% |
[ 2.0% - 2.5% ] 2.30% | 11,262,132 | 4.7% |
[ 2.5% - 3.0% ] 2.62% | 7,099,435 | 5.4% |
[ 2.5% - 3.0% ] 2.94% | 5,950,771 | 4.6% |
[ 3.0% - 3.5% ] 3.24% | 4,570,471 | 5.3% |
[ 3.5% - 4.0% ] 3.54% | 5,085,584 | 5.3% |
[ 3.5% - 4.0% ] 3.87% | 3,678,951 | 4.7% |
[ 4.0% - 4.5% ] 4.18% | 2,805,865 | 5.1% |
[ 4.0% - 4.5% ] 4.49% | 2,465,047 | 5.3% |
[ 4.5% - 5.0% ] 4.75% | 11,166,044 | 7.6% |
[ 5.0% - 5.5% ] 5.12% | 2,504,342 | 5.3% |
[ 5.0% - 5.5% ] 5.39% | 1,708,207 | 5.4% |
[ 5.5% - 6.0% ] 5.72% | 1,874,456 | 4.5% |
[ 6.0% - 6.5% ] 6.03% | 1,492,056 | 5.4% |
[ 6.0% - 6.5% ] 6.32% | 1,116,126 | 6.2% |
[ 6.5% - 7.0% ] 6.63% | 886,321 | 6.0% |
[ 6.5% - 7.0% ] 6.93% | 1,389,606 | 5.8% |
[ 7.0% - 7.5% ] 7.29% | 699,582 | 4.2% |
[ 7.5% - 8.0% ] 7.56% | 841,119 | 6.2% |
[ 7.5% - 8.0% ] 7.87% | 560,069 | 5.0% |
[ 8.0% - 8.5% ] 8.17% | 721,458 | 6.6% |
[ 8.5% - 9.0% ] 8.53% | 761,891 | 6.2% |
[ 8.5% - 9.0% ] 8.85% | 450,928 | 5.6% |
[ 9.0% - 9.5% ] 9.12% | 540,102 | 4.5% |
[ 9.0% - 9.5% ] 9.43% | 755,700 | 4.3% |
[ 9.5% - 10.0% ] 9.71% | 321,523 | 7.4% |
[ 10.0% - 10.5% ] 10.03% | 513,032 | 5.2% |
[ 10.0% - 10.5% ] 10.41% | 317,283 | 5.8% |
[ 10.5% - 11.0% ] 10.71% | 351,662 | 5.9% |
[ 11.0% - 11.5% ] 11.07% | 733,979 | 8.3% |
[ 11.0% - 11.5% ] 11.29% | 201,680 | 9.1% |
[ 11.5% - 12.0% ] 11.63% | 346,981 | 7.0% |
[ 11.5% - 12.0% ] 11.89% | 688,151 | 6.0% |
[ 12.0% - 12.5% ] 12.19% | 151,914 | 9.7% |
[ 12.0% - 12.5% ] 12.41% | 273,913 | 4.1% |
[ 12.5% - 13.0% ] 12.76% | 802,173 | 8.4% |
[ 13.0% - 13.5% ] 13.20% | 402,745 | 8.0% |
[ 13.5% - 14.0% ] 13.50% | 187,754 | 5.1% |
[ 13.5% - 14.0% ] 13.76% | 441,041 | 6.0% |
[ 14.0% - 14.5% ] 14.14% | 325,454 | 4.6% |
[ 14.0% - 14.5% ] 14.42% | 220,768 | 5.2% |
[ 14.5% - 15.0% ] 14.69% | 203,827 | 5.2% |
[ 14.5% - 15.0% ] 14.99% | 233,373 | 7.2% |
[ 15.0% - 15.5% ] 15.33% | 393,897 | 6.8% |
[ 15.5% - 16.0% ] 15.68% | 264,071 | 7.7% |
[ 15.5% - 16.0% ] 15.89% | 185,657 | 5.5% |
[ 16.0% - 16.5% ] 16.26% | 310,189 | 7.7% |
[ 16.5% - 17.0% ] 16.54% | 239,381 | 4.5% |
[ 16.5% - 17.0% ] 16.83% | 148,606 | 5.0% |
[ 17.0% - 17.5% ] 17.14% | 88,938 | 7.4% |
[ 17.5% - 18.0% ] 17.52% | 19,785 | 2.0% |
[ 17.5% - 18.0% ] 17.76% | 230,384 | 10.9% |
[ 18.0% - 18.5% ] 18.10% | 85,976 | 7.3% |
[ 18.0% - 18.5% ] 18.44% | 88,154 | 5.7% |
[ 18.5% - 19.0% ] 18.69% | 40,999 | 6.6% |
[ 18.5% - 19.0% ] 18.88% | 498 | 13.2% |
[ 19.0% - 19.5% ] 19.39% | 111,443 | 8.5% |
[ 19.5% - 20.0% ] 19.70% | 85,749 | 10.4% |
[ 19.5% - 20.0% ] 19.96% | 147,015 | 6.3% |
[ 20.0% - 20.5% ] 20.33% | 19,895 | 6.8% |
[ 20.5% - 21.0% ] 20.60% | 71,060 | 14.8% |
[ 20.5% - 21.0% ] 20.84% | 158,259 | 4.9% |
[ 21.0% - 21.5% ] 21.17% | 109,134 | 5.9% |
[ 21.5% - 22.0% ] 21.54% | 31,140 | 10.5% |
[ 21.5% - 22.0% ] 21.81% | 234,579 | 10.1% |
[ 22.0% - 22.5% ] 22.04% | 57,533 | 8.1% |
[ 22.0% - 22.5% ] 22.42% | 103,687 | 6.8% |
[ 22.5% - 23.0% ] 22.72% | 10,396 | 3.9% |
[ 23.0% - 23.5% ] 23.10% | 64,260 | 6.0% |
[ 23.0% - 23.5% ] 23.39% | 174,565 | 6.0% |
[ 23.5% - 24.0% ] 23.68% | 230,198 | 7.3% |
[ 23.5% - 24.0% ] 23.96% | 59,843 | 7.8% |
[ 24.0% - 24.5% ] 24.18% | 8,718 | 2.7% |
[ 24.5% - 25.0% ] 24.97% | 18,426 | 4.9% |
[ 25.0% - 25.5% ] 25.23% | 5,164 | 5.1% |
[ 25.0% - 25.5% ] 25.42% | 101,739 | 5.4% |
[ 25.5% - 26.0% ] 25.90% | 35,967 | 4.5% |
[ 26.0% - 26.5% ] 26.05% | 56,757 | 4.6% |
[ 26.0% - 26.5% ] 26.50% | 21,935 | 6.1% |
[ 26.5% - 27.0% ] 26.89% | 89,647 | 5.7% |
[ 27.0% - 27.5% ] 27.16% | 37,764 | 8.5% |
[ 27.0% - 27.5% ] 27.42% | 44,878 | 6.0% |
[ 27.5% - 28.0% ] 27.69% | 89,577 | 9.4% |
[ 28.0% - 28.5% ] 28.08% | 67,001 | 8.0% |
[ 28.5% - 29.0% ] 28.57% | 20,971 | 3.6% |
[ 28.5% - 29.0% ] 28.90% | 79,308 | 6.5% |
[ 29.0% - 29.5% ] 29.27% | 26,364 | 6.1% |
[ 29.0% - 29.5% ] 29.41% | 22,540 | 3.8% |
[ 29.5% - 30.0% ] 29.84% | 112,750 | 11.2% |
[ 30.0% - 30.5% ] 30.10% | 23,734 | 4.6% |
[ 31.0% - 31.5% ] 31.13% | 11,069 | 3.4% |
[ 31.0% - 31.5% ] 31.40% | 15,732 | 5.9% |
[ 32.0% - 32.5% ] 32.05% | 2,811 | 1.3% |
[ 35.0% - 35.5% ] 35.42% | 68,029 | 4.2% |
[ 36.0% - 36.5% ] 36.16% | 31,514 | 4.4% |
[ 38.0% - 38.5% ] 38.28% | 4,407 | 7.0% |
[ 38.5% - 39.0% ] 38.73% | 1,761 | 13.0% |
[ 40.0% - 40.5% ] 40.36% | 14,639 | 4.3% |
[ 40.5% - 41.0% ] 40.54% | 14,572 | 4.3% |
[ 41.0% - 41.5% ] 41.13% | 5,843 | 6.3% |
[ 50.5% - 51.0% ] 50.63% | 2,718 | 10.8% |
[ 61.5% - 62.0% ] 61.73% | 139,642 | 7.0% |