Ottawa Married-Couple Family Poverty

COMPARE

Ottawa
Race
Ancestry
AfghanAfricanAlaska NativeAlaskan AthabascanAlbanianAleutAlsatianAmericanApacheArabArapahoArgentineanArmenianAssyrian/Chaldean/SyriacAustralianAustrianBahamianBangladeshiBarbadianBasqueBelgianBelizeanBermudanBhutaneseBlackfeetBolivianBrazilianBritishBritish West IndianBulgarianBurmeseCajunCambodianCanadianCape VerdeanCarpatho RusynCelticCentral AmericanCentral American IndianCherokeeCheyenneChickasawChileanChineseChippewaChoctawColombianColvilleComancheCosta RicanCreeCreekCroatianCrowCubanCypriotCzechCzechoslovakianDanishDelawareDominicanDutchDutch West IndianEastern EuropeanEcuadorianEgyptianEnglishEstonianEthiopianEuropeanFijianFilipinoFinnishFrenchFrench American IndianFrench CanadianGermanGerman RussianGhanaianGreekGuamanian/ChamorroGuatemalanGuyaneseHaitianHmongHonduranHopiHoumaHungarianIcelanderIndian (Asian)IndonesianInupiatIranianIraqiIrishIroquoisIsraeliItalianJamaicanJapaneseJordanianKenyanKiowaKoreanLaotianLatvianLebaneseLiberianLithuanianLumbeeLuxembourgerMacedonianMalaysianMalteseMarshalleseMenomineeMexicanMexican American IndianMongolianMoroccanNative HawaiianNavajoNepaleseNew ZealanderNicaraguanNigerianNorthern EuropeanNorwegianOkinawanOsageOttawaPaiutePakistaniPalestinianPanamanianParaguayanPennsylvania GermanPeruvianPimaPolishPortuguesePotawatomiPuebloPuerto RicanPuget Sound SalishRomanianRussianSalvadoranSamoanScandinavianScotch-IrishScottishSeminoleSenegaleseSerbianShoshoneSierra LeoneanSiouxSlavicSlovakSloveneSomaliSouth AfricanSouth AmericanSouth American IndianSoviet UnionSpaniardSpanishSpanish AmericanSpanish American IndianSri LankanSubsaharan AfricanSudaneseSwedishSwissSyrianTaiwaneseThaiTlingit-HaidaTohono O'OdhamTonganTrinidadian and TobagonianTsimshianTurkishU.S. Virgin IslanderUgandanUkrainianUruguayanUteVenezuelanVietnameseWelshWest IndianYakamaYaquiYugoslavianYumanYup'ikZimbabwean
Immigration
NonimmigrantsImmigrantsAfghanistanAfricaAlbaniaArgentinaArmeniaAsiaAustraliaAustriaBahamasBangladeshBarbadosBelarusBelgiumBelizeBoliviaBosnia and HerzegovinaBrazilBulgariaBurma/MyanmarCabo VerdeCambodiaCameroonCanadaCaribbeanCentral AmericaChileChinaColombiaCongoCosta RicaCroatiaCubaCzechoslovakiaDenmarkDominicaDominican RepublicEastern AfricaEastern AsiaEastern EuropeEcuadorEgyptEl SalvadorEnglandEritreaEthiopiaEuropeFijiFranceGermanyGhanaGreeceGrenadaGuatemalaGuyanaHaitiHondurasHong KongHungaryIndiaIndonesiaIranIraqIrelandIsraelItalyJamaicaJapanJordanKazakhstanKenyaKoreaKuwaitLaosLatin AmericaLatviaLebanonLiberiaLithuaniaMalaysiaMexicoMicronesiaMiddle AfricaMoldovaMoroccoNepalNetherlandsNicaraguaNigeriaNorth AmericaNorth MacedoniaNorthern AfricaNorthern EuropeNorwayOceaniaPakistanPanamaPeruPhilippinesPolandPortugalRomaniaRussiaSaudi ArabiaScotlandSenegalSerbiaSierra LeoneSingaporeSomaliaSouth AfricaSouth AmericaSouth Central AsiaSouth Eastern AsiaSouthern EuropeSpainSri LankaSt. Vincent and the GrenadinesSudanSwedenSwitzerlandSyriaTaiwanThailandTrinidad and TobagoTurkeyUgandaUkraineUruguayUzbekistanVenezuelaVietnamWest IndiesWestern AfricaWestern AsiaWestern EuropeYemenZaireZimbabweAzores
Select to Compare
Race
Ancestry
AfghanAfricanAlaska NativeAlaskan AthabascanAlbanianAleutAlsatianAmericanApacheArabArapahoArgentineanArmenianAssyrian/Chaldean/SyriacAustralianAustrianBahamianBangladeshiBarbadianBasqueBelgianBelizeanBermudanBhutaneseBlackfeetBolivianBrazilianBritishBritish West IndianBulgarianBurmeseCajunCambodianCanadianCape VerdeanCarpatho RusynCelticCentral AmericanCentral American IndianCherokeeCheyenneChickasawChileanChineseChippewaChoctawColombianColvilleComancheCosta RicanCreeCreekCroatianCrowCubanCypriotCzechCzechoslovakianDanishDelawareDominicanDutchDutch West IndianEastern EuropeanEcuadorianEgyptianEnglishEstonianEthiopianEuropeanFijianFilipinoFinnishFrenchFrench American IndianFrench CanadianGermanGerman RussianGhanaianGreekGuamanian/ChamorroGuatemalanGuyaneseHaitianHmongHonduranHopiHoumaHungarianIcelanderIndian (Asian)IndonesianInupiatIranianIraqiIrishIroquoisIsraeliItalianJamaicanJapaneseJordanianKenyanKiowaKoreanLaotianLatvianLebaneseLiberianLithuanianLumbeeLuxembourgerMacedonianMalaysianMalteseMarshalleseMenomineeMexicanMexican American IndianMongolianMoroccanNative HawaiianNavajoNepaleseNew ZealanderNicaraguanNigerianNorthern EuropeanNorwegianOkinawanOsagePaiutePakistaniPalestinianPanamanianParaguayanPennsylvania GermanPeruvianPimaPolishPortuguesePotawatomiPuebloPuerto RicanPuget Sound SalishRomanianRussianSalvadoranSamoanScandinavianScotch-IrishScottishSeminoleSenegaleseSerbianShoshoneSierra LeoneanSiouxSlavicSlovakSloveneSomaliSouth AfricanSouth AmericanSouth American IndianSoviet UnionSpaniardSpanishSpanish AmericanSpanish American IndianSri LankanSubsaharan AfricanSudaneseSwedishSwissSyrianTaiwaneseThaiTlingit-HaidaTohono O'OdhamTonganTrinidadian and TobagonianTsimshianTurkishU.S. Virgin IslanderUgandanUkrainianUruguayanUteVenezuelanVietnameseWelshWest IndianYakamaYaquiYugoslavianYumanYup'ikZimbabwean
Immigration
NonimmigrantsImmigrantsAfghanistanAfricaAlbaniaArgentinaArmeniaAsiaAustraliaAustriaBahamasBangladeshBarbadosBelarusBelgiumBelizeBoliviaBosnia and HerzegovinaBrazilBulgariaBurma/MyanmarCabo VerdeCambodiaCameroonCanadaCaribbeanCentral AmericaChileChinaColombiaCongoCosta RicaCroatiaCubaCzechoslovakiaDenmarkDominicaDominican RepublicEastern AfricaEastern AsiaEastern EuropeEcuadorEgyptEl SalvadorEnglandEritreaEthiopiaEuropeFijiFranceGermanyGhanaGreeceGrenadaGuatemalaGuyanaHaitiHondurasHong KongHungaryIndiaIndonesiaIranIraqIrelandIsraelItalyJamaicaJapanJordanKazakhstanKenyaKoreaKuwaitLaosLatin AmericaLatviaLebanonLiberiaLithuaniaMalaysiaMexicoMicronesiaMiddle AfricaMoldovaMoroccoNepalNetherlandsNicaraguaNigeriaNorth AmericaNorth MacedoniaNorthern AfricaNorthern EuropeNorwayOceaniaPakistanPanamaPeruPhilippinesPolandPortugalRomaniaRussiaSaudi ArabiaScotlandSenegalSerbiaSierra LeoneSingaporeSomaliaSouth AfricaSouth AmericaSouth Central AsiaSouth Eastern AsiaSouthern EuropeSpainSri LankaSt. Vincent and the GrenadinesSudanSwedenSwitzerlandSyriaTaiwanThailandTrinidad and TobagoTurkeyUgandaUkraineUruguayUzbekistanVenezuelaVietnamWest IndiesWestern AfricaWestern AsiaWestern EuropeYemenZaireZimbabweAzores
Married-Couple Family Poverty
Income
Poverty
Unemployment
Labor Participation
Family Structure
Vehicle Availability
Education Level
Disability

Ottawa Married-Couple Family Poverty
Average

5.2%
POVERTY | MARRIED-COUPLE FAMILIES
54.5/ 100
METRIC RATING
169th/ 347
METRIC RANK

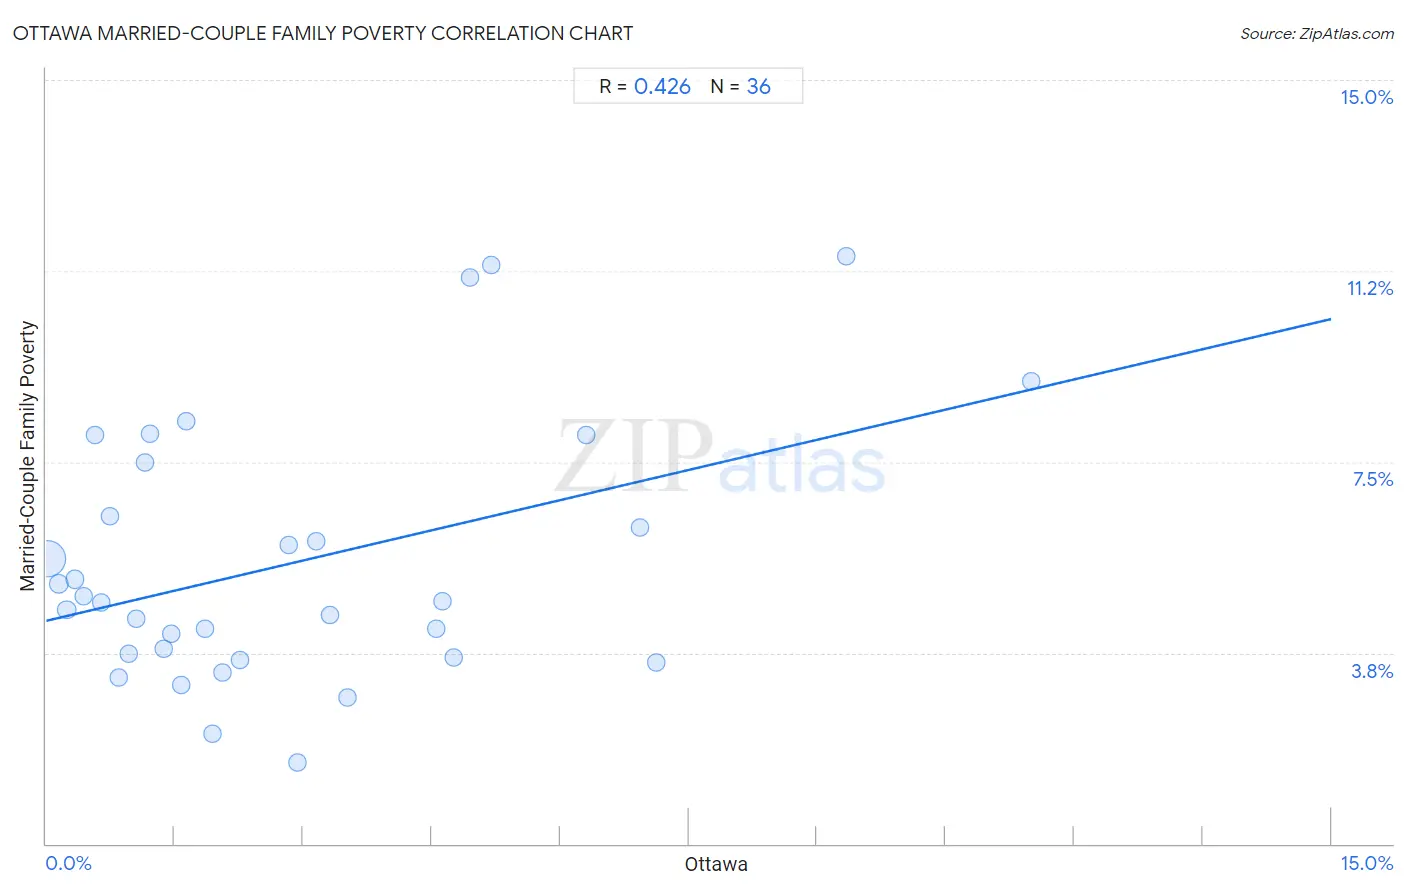
Ottawa Married-Couple Family Poverty Correlation Chart

The statistical analysis conducted on geographies consisting of 49,836,436 people shows a moderate positive correlation between the proportion of Ottawa and poverty level among married-couple families in the United States with a correlation coefficient (R) of 0.426 and weighted average of 5.2%. On average, for every 1% (one percent) increase in Ottawa within a typical geography, there is an increase of 0.40% in poverty level among married-couple families.
Ottawa Married-Couple Family Poverty
It is essential to understand that the correlation between the percentage of Ottawa and poverty level among married-couple families does not imply a direct cause-and-effect relationship. It remains uncertain whether the presence of Ottawa influences an upward or downward trend in the level of poverty level among married-couple families within an area, or if Ottawa simply ended up residing in those areas with higher or lower levels of poverty level among married-couple families due to other factors.

Demographics Similar to Ottawa by Married-Couple Family Poverty

In terms of married-couple family poverty, the demographic groups most similar to Ottawa are Immigrants from Argentina (5.2%, a difference of 0.010%), Immigrants from Uganda (5.2%, a difference of 0.040%), Bermudan (5.2%, a difference of 0.19%), Immigrants from Northern Africa (5.2%, a difference of 0.37%), and Alsatian (5.2%, a difference of 0.39%).
DemographicsRating | RankMarried-Couple Family Poverty
Immigrants from Jordan
66.5
/100
|
#162
Good
5.1%
Sierra Leoneans
64.1
/100
|
#163
Good
5.1%
Hawaiians
62.3
/100
|
#164
Good
5.1%
Immigrants from Malaysia
62.2
/100
|
#165
Good
5.1%
Paraguayans
61.5
/100
|
#166
Good
5.1%
Costa Ricans
61.5
/100
|
#167
Good
5.1%
Immigrants from Uganda
54.9
/100
|
#168
Average
5.2%
Ottawa
54.5
/100
|
#169
Average
5.2%
Immigrants from Argentina
54.4
/100
|
#170
Average
5.2%
Bermudans
52.9
/100
|
#171
Average
5.2%
Immigrants from Northern Africa
51.3
/100
|
#172
Average
5.2%
Alsatians
51.2
/100
|
#173
Average
5.2%
Immigrants from Eastern Africa
50.0
/100
|
#174
Average
5.2%
Marshallese
47.9
/100
|
#175
Average
5.2%
Menominee
47.8
/100
|
#176
Average
5.2%

Ottawa Married-Couple Family Poverty Correlation Summary

MeasurementOttawa DataMarried-Couple Family Poverty Data
Minimum0.015%1.6%
Maximum11.5%11.5%
Range11.5%10.0%
Mean2.9%5.5%
Median1.9%4.8%
Interquartile 25% (IQ1)0.90%3.7%
Interquartile 75% (IQ3)4.6%7.0%
Interquartile Range (IQR)3.7%3.3%
Standard Deviation (Sample)2.7%2.5%
Standard Deviation (Population)2.7%2.5%

Correlation Details

Ottawa PercentileSample SizeMarried-Couple Family Poverty
[
0.0%
-
0.5%
]
0.015%
45,077,3555.6%
[
0.0%
-
0.5%
]
0.14%
2,764,9865.1%
[
0.0%
-
0.5%
]
0.24%
894,8424.6%
[
0.0%
-
0.5%
]
0.34%
465,0035.2%
[
0.0%
-
0.5%
]
0.43%
160,3254.9%
[
0.5%
-
1.0%
]
0.56%
55,8628.0%
[
0.5%
-
1.0%
]
0.64%
95,0074.8%
[
0.5%
-
1.0%
]
0.74%
109,7626.4%
[
0.5%
-
1.0%
]
0.85%
32,9743.3%
[
0.5%
-
1.0%
]
0.96%
7,5073.7%
[
1.0%
-
1.5%
]
1.06%
14,2984.4%
[
1.0%
-
1.5%
]
1.15%
40,1807.5%
[
1.0%
-
1.5%
]
1.21%
3,2158.1%
[
1.0%
-
1.5%
]
1.37%
28,4763.8%
[
1.0%
-
1.5%
]
1.47%
5,3904.1%
[
1.5%
-
2.0%
]
1.58%
17,0333.1%
[
1.5%
-
2.0%
]
1.63%
4,6638.3%
[
1.5%
-
2.0%
]
1.85%
6,7104.2%
[
1.5%
-
2.0%
]
1.94%
15,7082.2%
[
2.0%
-
2.5%
]
2.05%
1,9483.4%
[
2.0%
-
2.5%
]
2.27%
10,6763.6%
[
2.5%
-
3.0%
]
2.83%
6365.9%
[
2.5%
-
3.0%
]
2.93%
5,1481.6%
[
3.0%
-
3.5%
]
3.15%
6,8945.9%
[
3.0%
-
3.5%
]
3.32%
4524.5%
[
3.5%
-
4.0%
]
3.52%
1,9912.9%
[
4.5%
-
5.0%
]
4.56%
3514.2%
[
4.5%
-
5.0%
]
4.62%
3684.8%
[
4.5%
-
5.0%
]
4.76%
4,8573.7%
[
4.5%
-
5.0%
]
4.95%
20211.1%
[
5.0%
-
5.5%
]
5.20%
25011.4%
[
6.0%
-
6.5%
]
6.30%
1,0318.0%
[
6.5%
-
7.0%
]
6.93%
1,4156.2%
[
7.0%
-
7.5%
]
7.11%
7593.6%
[
9.0%
-
9.5%
]
9.33%
7511.5%
[
11.0%
-
11.5%
]
11.49%
879.1%