Immigrants from Venezuela Married-Couple Family Poverty

COMPARE

Immigrants from Venezuela
Race
Ancestry
AfghanAfricanAlaska NativeAlaskan AthabascanAlbanianAleutAlsatianAmericanApacheArabArapahoArgentineanArmenianAssyrian/Chaldean/SyriacAustralianAustrianBahamianBangladeshiBarbadianBasqueBelgianBelizeanBermudanBhutaneseBlackfeetBolivianBrazilianBritishBritish West IndianBulgarianBurmeseCajunCambodianCanadianCape VerdeanCarpatho RusynCelticCentral AmericanCentral American IndianCherokeeCheyenneChickasawChileanChineseChippewaChoctawColombianColvilleComancheCosta RicanCreeCreekCroatianCrowCubanCypriotCzechCzechoslovakianDanishDelawareDominicanDutchDutch West IndianEastern EuropeanEcuadorianEgyptianEnglishEstonianEthiopianEuropeanFijianFilipinoFinnishFrenchFrench American IndianFrench CanadianGermanGerman RussianGhanaianGreekGuamanian/ChamorroGuatemalanGuyaneseHaitianHmongHonduranHopiHoumaHungarianIcelanderIndian (Asian)IndonesianInupiatIranianIraqiIrishIroquoisIsraeliItalianJamaicanJapaneseJordanianKenyanKiowaKoreanLaotianLatvianLebaneseLiberianLithuanianLumbeeLuxembourgerMacedonianMalaysianMalteseMarshalleseMenomineeMexicanMexican American IndianMongolianMoroccanNative HawaiianNavajoNepaleseNew ZealanderNicaraguanNigerianNorthern EuropeanNorwegianOkinawanOsageOttawaPaiutePakistaniPalestinianPanamanianParaguayanPennsylvania GermanPeruvianPimaPolishPortuguesePotawatomiPuebloPuerto RicanPuget Sound SalishRomanianRussianSalvadoranSamoanScandinavianScotch-IrishScottishSeminoleSenegaleseSerbianShoshoneSierra LeoneanSiouxSlavicSlovakSloveneSomaliSouth AfricanSouth AmericanSouth American IndianSoviet UnionSpaniardSpanishSpanish AmericanSpanish American IndianSri LankanSubsaharan AfricanSudaneseSwedishSwissSyrianTaiwaneseThaiTlingit-HaidaTohono O'OdhamTonganTrinidadian and TobagonianTsimshianTurkishU.S. Virgin IslanderUgandanUkrainianUruguayanUteVenezuelanVietnameseWelshWest IndianYakamaYaquiYugoslavianYumanYup'ikZimbabwean
Immigration
NonimmigrantsImmigrantsAfghanistanAfricaAlbaniaArgentinaArmeniaAsiaAustraliaAustriaBahamasBangladeshBarbadosBelarusBelgiumBelizeBoliviaBosnia and HerzegovinaBrazilBulgariaBurma/MyanmarCabo VerdeCambodiaCameroonCanadaCaribbeanCentral AmericaChileChinaColombiaCongoCosta RicaCroatiaCubaCzechoslovakiaDenmarkDominicaDominican RepublicEastern AfricaEastern AsiaEastern EuropeEcuadorEgyptEl SalvadorEnglandEritreaEthiopiaEuropeFijiFranceGermanyGhanaGreeceGrenadaGuatemalaGuyanaHaitiHondurasHong KongHungaryIndiaIndonesiaIranIraqIrelandIsraelItalyJamaicaJapanJordanKazakhstanKenyaKoreaKuwaitLaosLatin AmericaLatviaLebanonLiberiaLithuaniaMalaysiaMexicoMicronesiaMiddle AfricaMoldovaMoroccoNepalNetherlandsNicaraguaNigeriaNorth AmericaNorth MacedoniaNorthern AfricaNorthern EuropeNorwayOceaniaPakistanPanamaPeruPhilippinesPolandPortugalRomaniaRussiaSaudi ArabiaScotlandSenegalSerbiaSierra LeoneSingaporeSomaliaSouth AfricaSouth AmericaSouth Central AsiaSouth Eastern AsiaSouthern EuropeSpainSri LankaSt. Vincent and the GrenadinesSudanSwedenSwitzerlandSyriaTaiwanThailandTrinidad and TobagoTurkeyUgandaUkraineUruguayUzbekistanVenezuelaVietnamWest IndiesWestern AfricaWestern AsiaWestern EuropeYemenZaireZimbabweAzores
Select to Compare
Race
Ancestry
AfghanAfricanAlaska NativeAlaskan AthabascanAlbanianAleutAlsatianAmericanApacheArabArapahoArgentineanArmenianAssyrian/Chaldean/SyriacAustralianAustrianBahamianBangladeshiBarbadianBasqueBelgianBelizeanBermudanBhutaneseBlackfeetBolivianBrazilianBritishBritish West IndianBulgarianBurmeseCajunCambodianCanadianCape VerdeanCarpatho RusynCelticCentral AmericanCentral American IndianCherokeeCheyenneChickasawChileanChineseChippewaChoctawColombianColvilleComancheCosta RicanCreeCreekCroatianCrowCubanCypriotCzechCzechoslovakianDanishDelawareDominicanDutchDutch West IndianEastern EuropeanEcuadorianEgyptianEnglishEstonianEthiopianEuropeanFijianFilipinoFinnishFrenchFrench American IndianFrench CanadianGermanGerman RussianGhanaianGreekGuamanian/ChamorroGuatemalanGuyaneseHaitianHmongHonduranHopiHoumaHungarianIcelanderIndian (Asian)IndonesianInupiatIranianIraqiIrishIroquoisIsraeliItalianJamaicanJapaneseJordanianKenyanKiowaKoreanLaotianLatvianLebaneseLiberianLithuanianLumbeeLuxembourgerMacedonianMalaysianMalteseMarshalleseMenomineeMexicanMexican American IndianMongolianMoroccanNative HawaiianNavajoNepaleseNew ZealanderNicaraguanNigerianNorthern EuropeanNorwegianOkinawanOsageOttawaPaiutePakistaniPalestinianPanamanianParaguayanPennsylvania GermanPeruvianPimaPolishPortuguesePotawatomiPuebloPuerto RicanPuget Sound SalishRomanianRussianSalvadoranSamoanScandinavianScotch-IrishScottishSeminoleSenegaleseSerbianShoshoneSierra LeoneanSiouxSlavicSlovakSloveneSomaliSouth AfricanSouth AmericanSouth American IndianSoviet UnionSpaniardSpanishSpanish AmericanSpanish American IndianSri LankanSubsaharan AfricanSudaneseSwedishSwissSyrianTaiwaneseThaiTlingit-HaidaTohono O'OdhamTonganTrinidadian and TobagonianTsimshianTurkishU.S. Virgin IslanderUgandanUkrainianUruguayanUteVenezuelanVietnameseWelshWest IndianYakamaYaquiYugoslavianYumanYup'ikZimbabwean
Immigration
NonimmigrantsImmigrantsAfghanistanAfricaAlbaniaArgentinaArmeniaAsiaAustraliaAustriaBahamasBangladeshBarbadosBelarusBelgiumBelizeBoliviaBosnia and HerzegovinaBrazilBulgariaBurma/MyanmarCabo VerdeCambodiaCameroonCanadaCaribbeanCentral AmericaChileChinaColombiaCongoCosta RicaCroatiaCubaCzechoslovakiaDenmarkDominicaDominican RepublicEastern AfricaEastern AsiaEastern EuropeEcuadorEgyptEl SalvadorEnglandEritreaEthiopiaEuropeFijiFranceGermanyGhanaGreeceGrenadaGuatemalaGuyanaHaitiHondurasHong KongHungaryIndiaIndonesiaIranIraqIrelandIsraelItalyJamaicaJapanJordanKazakhstanKenyaKoreaKuwaitLaosLatin AmericaLatviaLebanonLiberiaLithuaniaMalaysiaMexicoMicronesiaMiddle AfricaMoldovaMoroccoNepalNetherlandsNicaraguaNigeriaNorth AmericaNorth MacedoniaNorthern AfricaNorthern EuropeNorwayOceaniaPakistanPanamaPeruPhilippinesPolandPortugalRomaniaRussiaSaudi ArabiaScotlandSenegalSerbiaSierra LeoneSingaporeSomaliaSouth AfricaSouth AmericaSouth Central AsiaSouth Eastern AsiaSouthern EuropeSpainSri LankaSt. Vincent and the GrenadinesSudanSwedenSwitzerlandSyriaTaiwanThailandTrinidad and TobagoTurkeyUgandaUkraineUruguayUzbekistanVietnamWest IndiesWestern AfricaWestern AsiaWestern EuropeYemenZaireZimbabweAzores
Married-Couple Family Poverty
Income
Poverty
Unemployment
Labor Participation
Family Structure
Vehicle Availability
Education Level
Disability

Immigrants from Venezuela Married-Couple Family Poverty
Tragic

5.8%
POVERTY | MARRIED-COUPLE FAMILIES
1.8/ 100
METRIC RATING
246th/ 347
METRIC RANK

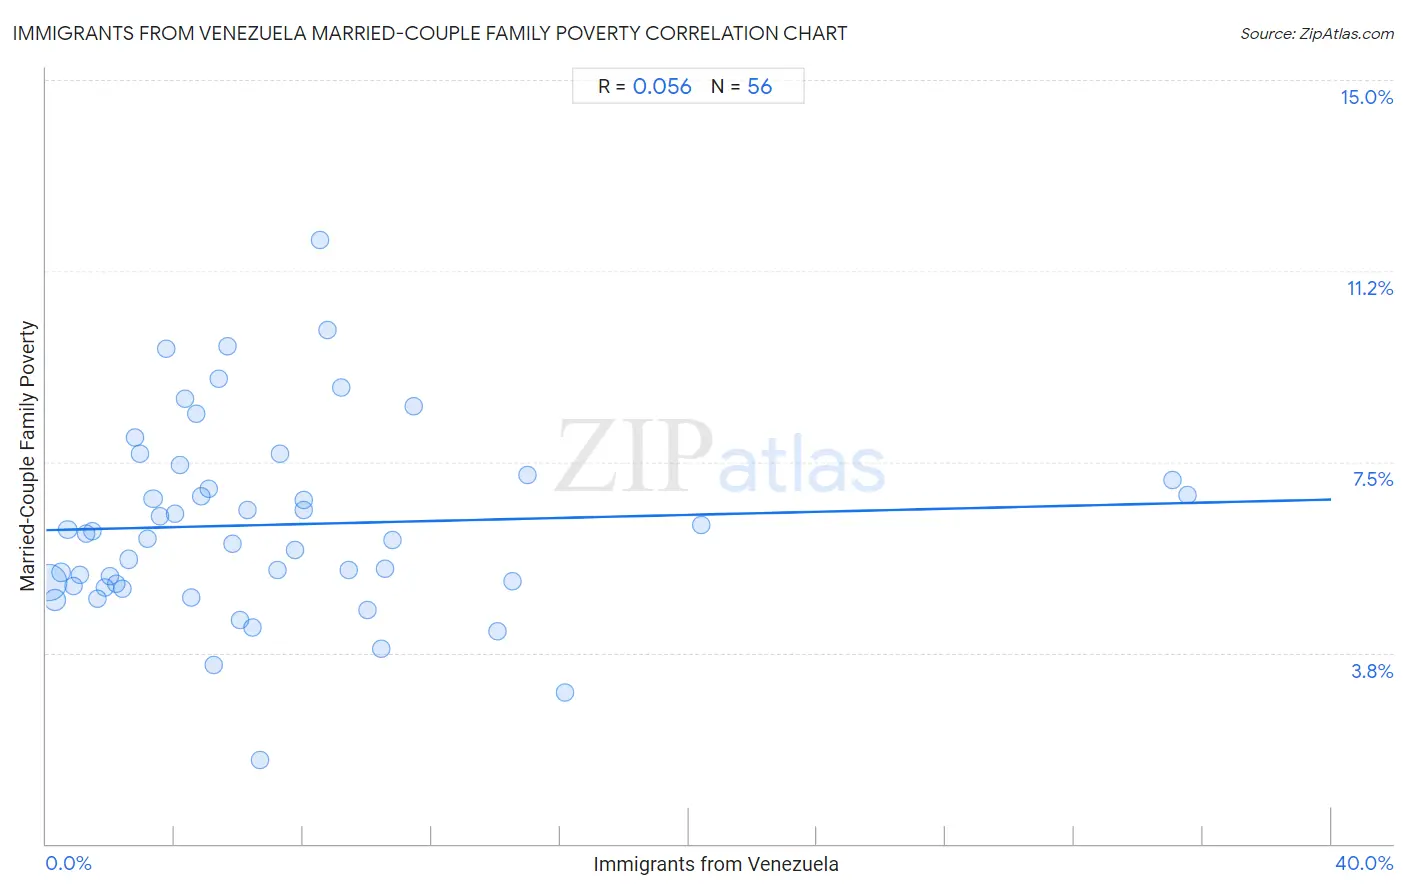
Immigrants from Venezuela Married-Couple Family Poverty Correlation Chart

The statistical analysis conducted on geographies consisting of 286,630,688 people shows a slight positive correlation between the proportion of Immigrants from Venezuela and poverty level among married-couple families in the United States with a correlation coefficient (R) of 0.056 and weighted average of 5.8%. On average, for every 1% (one percent) increase in Immigrants from Venezuela within a typical geography, there is an increase of 0.015% in poverty level among married-couple families.
Immigrants from Venezuela Married-Couple Family Poverty
It is essential to understand that the correlation between the percentage of Immigrants from Venezuela and poverty level among married-couple families does not imply a direct cause-and-effect relationship. It remains uncertain whether the presence of Immigrants from Venezuela influences an upward or downward trend in the level of poverty level among married-couple families within an area, or if Immigrants from Venezuela simply ended up residing in those areas with higher or lower levels of poverty level among married-couple families due to other factors.

Demographics Similar to Immigrants from Venezuela by Married-Couple Family Poverty

In terms of married-couple family poverty, the demographic groups most similar to Immigrants from Venezuela are Immigrants from Afghanistan (5.8%, a difference of 0.52%), Iraqi (5.9%, a difference of 0.62%), Chickasaw (5.8%, a difference of 0.66%), Somali (5.8%, a difference of 0.68%), and Immigrants from Western Africa (5.8%, a difference of 0.83%).
DemographicsRating | RankMarried-Couple Family Poverty
Venezuelans
2.7
/100
|
#239
Tragic
5.8%
Fijians
2.5
/100
|
#240
Tragic
5.8%
Immigrants from Panama
2.5
/100
|
#241
Tragic
5.8%
Immigrants from Western Africa
2.4
/100
|
#242
Tragic
5.8%
Somalis
2.3
/100
|
#243
Tragic
5.8%
Chickasaw
2.3
/100
|
#244
Tragic
5.8%
Immigrants from Afghanistan
2.1
/100
|
#245
Tragic
5.8%
Immigrants from Venezuela
1.8
/100
|
#246
Tragic
5.8%
Iraqis
1.4
/100
|
#247
Tragic
5.9%
Cree
1.2
/100
|
#248
Tragic
5.9%
Tsimshian
1.1
/100
|
#249
Tragic
5.9%
Immigrants from Eritrea
1.1
/100
|
#250
Tragic
5.9%
Immigrants from Ghana
1.0
/100
|
#251
Tragic
5.9%
Immigrants from Western Asia
0.7
/100
|
#252
Tragic
6.0%
Africans
0.7
/100
|
#253
Tragic
6.0%

Immigrants from Venezuela Married-Couple Family Poverty Correlation Summary

MeasurementImmigrants from Venezuela DataMarried-Couple Family Poverty Data
Minimum0.077%1.7%
Maximum35.5%11.8%
Range35.5%10.2%
Mean7.1%6.3%
Median5.3%6.0%
Interquartile 25% (IQ1)2.7%5.1%
Interquartile 75% (IQ3)8.9%7.2%
Interquartile Range (IQR)6.3%2.1%
Standard Deviation (Sample)7.0%1.9%
Standard Deviation (Population)7.0%1.9%

Correlation Details

Immigrants from Venezuela PercentileSample SizeMarried-Couple Family Poverty
[
0.0%
-
0.5%
]
0.077%
198,174,6335.1%
[
0.0%
-
0.5%
]
0.27%
40,517,3714.8%
[
0.0%
-
0.5%
]
0.46%
16,395,9025.3%
[
0.5%
-
1.0%
]
0.67%
9,264,3666.2%
[
0.5%
-
1.0%
]
0.85%
4,915,4935.1%
[
1.0%
-
1.5%
]
1.03%
2,618,8645.3%
[
1.0%
-
1.5%
]
1.24%
2,597,7586.1%
[
1.0%
-
1.5%
]
1.43%
1,744,3216.1%
[
1.5%
-
2.0%
]
1.61%
1,055,5274.8%
[
1.5%
-
2.0%
]
1.84%
690,7315.0%
[
1.5%
-
2.0%
]
2.00%
1,540,1795.3%
[
2.0%
-
2.5%
]
2.18%
299,4885.1%
[
2.0%
-
2.5%
]
2.36%
740,7675.0%
[
2.5%
-
3.0%
]
2.56%
528,7505.6%
[
2.5%
-
3.0%
]
2.76%
314,8888.0%
[
2.5%
-
3.0%
]
2.94%
247,3637.7%
[
3.0%
-
3.5%
]
3.15%
363,9746.0%
[
3.0%
-
3.5%
]
3.33%
420,1556.8%
[
3.5%
-
4.0%
]
3.55%
655,4486.4%
[
3.5%
-
4.0%
]
3.72%
593,0589.7%
[
3.5%
-
4.0%
]
3.99%
94,0796.5%
[
4.0%
-
4.5%
]
4.15%
433,8847.4%
[
4.0%
-
4.5%
]
4.30%
348,9848.7%
[
4.5%
-
5.0%
]
4.52%
196,1794.8%
[
4.5%
-
5.0%
]
4.68%
132,1808.4%
[
4.5%
-
5.0%
]
4.82%
240,2116.8%
[
5.0%
-
5.5%
]
5.05%
119,7327.0%
[
5.0%
-
5.5%
]
5.22%
46,4843.5%
[
5.0%
-
5.5%
]
5.36%
95,0819.1%
[
5.5%
-
6.0%
]
5.65%
146,9769.8%
[
5.5%
-
6.0%
]
5.81%
15,1845.9%
[
6.0%
-
6.5%
]
6.02%
240,2414.4%
[
6.0%
-
6.5%
]
6.26%
22,2026.5%
[
6.0%
-
6.5%
]
6.41%
79,8234.2%
[
6.5%
-
7.0%
]
6.65%
27,2281.7%
[
7.0%
-
7.5%
]
7.19%
56,5895.4%
[
7.0%
-
7.5%
]
7.27%
25,2837.7%
[
7.5%
-
8.0%
]
7.72%
22,1115.8%
[
8.0%
-
8.5%
]
8.00%
19,8956.8%
[
8.0%
-
8.5%
]
8.02%
2126.6%
[
8.5%
-
9.0%
]
8.53%
48,80811.8%
[
8.5%
-
9.0%
]
8.74%
49,88810.1%
[
9.0%
-
9.5%
]
9.16%
14,5579.0%
[
9.0%
-
9.5%
]
9.43%
2,4195.4%
[
10.0%
-
10.5%
]
10.01%
23,7344.6%
[
10.0%
-
10.5%
]
10.44%
22,5403.8%
[
10.5%
-
11.0%
]
10.53%
66,2995.4%
[
10.5%
-
11.0%
]
10.78%
57,0666.0%
[
11.0%
-
11.5%
]
11.46%
20,0348.6%
[
14.0%
-
14.5%
]
14.06%
68,0294.2%
[
14.5%
-
15.0%
]
14.53%
57,8785.2%
[
14.5%
-
15.0%
]
14.96%
5487.2%
[
16.0%
-
16.5%
]
16.13%
11,8093.0%
[
20.0%
-
20.5%
]
20.40%
5,8436.3%
[
35.0%
-
35.5%
]
35.06%
64,7517.1%
[
35.5%
-
36.0%
]
35.53%
74,8916.8%