Immigrants from Belarus Married-Couple Family Poverty
COMPARE
Immigrants from Belarus
Select to Compare
Married-Couple Family Poverty
Immigrants from Belarus Married-Couple Family Poverty
5.4%
POVERTY | MARRIED-COUPLE FAMILIES
26.2/ 100
METRIC RATING
198th/ 347
METRIC RANK
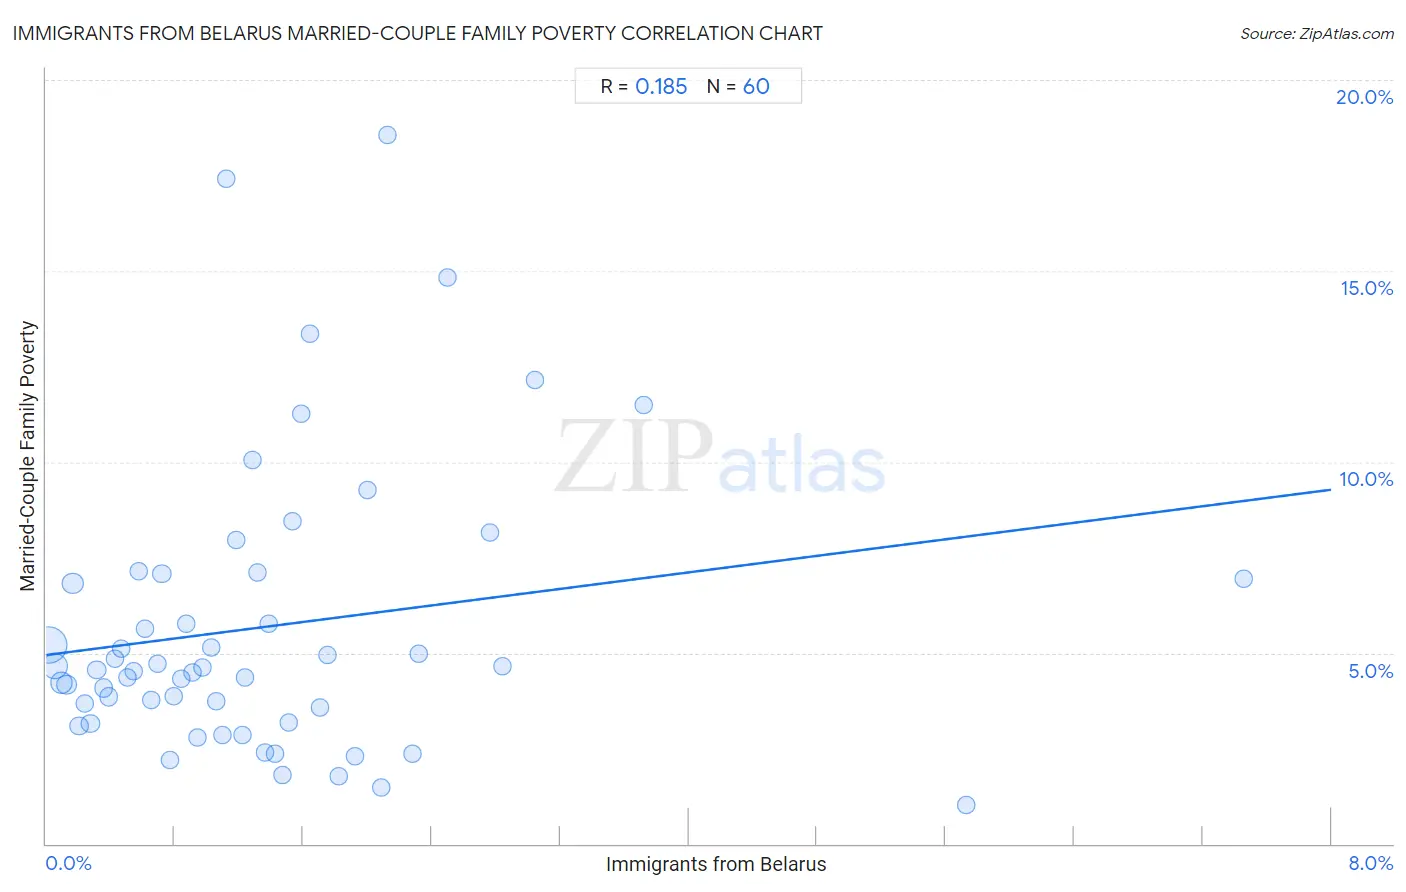
Immigrants from Belarus Married-Couple Family Poverty Correlation Chart
The statistical analysis conducted on geographies consisting of 149,577,130 people shows a poor positive correlation between the proportion of Immigrants from Belarus and poverty level among married-couple families in the United States with a correlation coefficient (R) of 0.185 and weighted average of 5.4%. On average, for every 1% (one percent) increase in Immigrants from Belarus within a typical geography, there is an increase of 0.54% in poverty level among married-couple families.
It is essential to understand that the correlation between the percentage of Immigrants from Belarus and poverty level among married-couple families does not imply a direct cause-and-effect relationship. It remains uncertain whether the presence of Immigrants from Belarus influences an upward or downward trend in the level of poverty level among married-couple families within an area, or if Immigrants from Belarus simply ended up residing in those areas with higher or lower levels of poverty level among married-couple families due to other factors.
Demographics Similar to Immigrants from Belarus by Married-Couple Family Poverty
In terms of married-couple family poverty, the demographic groups most similar to Immigrants from Belarus are Liberian (5.4%, a difference of 0.020%), Spaniard (5.4%, a difference of 0.18%), Uruguayan (5.4%, a difference of 0.18%), Immigrants from the Azores (5.4%, a difference of 0.20%), and Immigrants from Israel (5.4%, a difference of 0.24%).
| Demographics | Rating | Rank | Married-Couple Family Poverty |
| Immigrants from Cabo Verde | 30.9 /100 | #191 | Fair 5.3% |
| Cape Verdeans | 30.7 /100 | #192 | Fair 5.3% |
| Malaysians | 29.5 /100 | #193 | Fair 5.4% |
| Immigrants from Israel | 27.8 /100 | #194 | Fair 5.4% |
| Immigrants from the Azores | 27.5 /100 | #195 | Fair 5.4% |
| Spaniards | 27.4 /100 | #196 | Fair 5.4% |
| Liberians | 26.3 /100 | #197 | Fair 5.4% |
| Immigrants from Belarus | 26.2 /100 | #198 | Fair 5.4% |
| Uruguayans | 25.0 /100 | #199 | Fair 5.4% |
| Immigrants from Morocco | 24.3 /100 | #200 | Fair 5.4% |
| Lebanese | 24.1 /100 | #201 | Fair 5.4% |
| Immigrants from Middle Africa | 23.8 /100 | #202 | Fair 5.4% |
| Immigrants from Peru | 21.8 /100 | #203 | Fair 5.4% |
| Immigrants from Costa Rica | 19.4 /100 | #204 | Poor 5.4% |
| Chippewa | 18.9 /100 | #205 | Poor 5.4% |
Immigrants from Belarus Married-Couple Family Poverty Correlation Summary
| Measurement | Immigrants from Belarus Data | Married-Couple Family Poverty Data |
| Minimum | 0.017% | 1.0% |
| Maximum | 7.5% | 18.5% |
| Range | 7.4% | 17.5% |
| Mean | 1.4% | 5.7% |
| Median | 1.1% | 4.6% |
| Interquartile 25% (IQ1) | 0.56% | 3.4% |
| Interquartile 75% (IQ3) | 1.7% | 7.0% |
| Interquartile Range (IQR) | 1.2% | 3.6% |
| Standard Deviation (Sample) | 1.3% | 3.7% |
| Standard Deviation (Population) | 1.3% | 3.7% |
Correlation Details
| Immigrants from Belarus Percentile | Sample Size | Married-Couple Family Poverty |
[ 0.0% - 0.5% ] 0.017% | 73,523,640 | 5.2% |
[ 0.0% - 0.5% ] 0.051% | 30,021,080 | 4.6% |
[ 0.0% - 0.5% ] 0.092% | 13,035,257 | 4.2% |
[ 0.0% - 0.5% ] 0.13% | 7,070,148 | 4.2% |
[ 0.0% - 0.5% ] 0.17% | 12,726,487 | 6.8% |
[ 0.0% - 0.5% ] 0.20% | 2,570,650 | 3.1% |
[ 0.0% - 0.5% ] 0.24% | 1,856,905 | 3.7% |
[ 0.0% - 0.5% ] 0.28% | 1,511,425 | 3.1% |
[ 0.0% - 0.5% ] 0.31% | 1,284,885 | 4.5% |
[ 0.0% - 0.5% ] 0.36% | 875,659 | 4.1% |
[ 0.0% - 0.5% ] 0.39% | 682,963 | 3.8% |
[ 0.0% - 0.5% ] 0.43% | 469,490 | 4.8% |
[ 0.0% - 0.5% ] 0.46% | 588,265 | 5.1% |
[ 0.5% - 1.0% ] 0.50% | 292,660 | 4.4% |
[ 0.5% - 1.0% ] 0.54% | 425,252 | 4.5% |
[ 0.5% - 1.0% ] 0.58% | 246,233 | 7.1% |
[ 0.5% - 1.0% ] 0.61% | 188,295 | 5.6% |
[ 0.5% - 1.0% ] 0.65% | 65,263 | 3.8% |
[ 0.5% - 1.0% ] 0.69% | 152,320 | 4.7% |
[ 0.5% - 1.0% ] 0.72% | 267,159 | 7.1% |
[ 0.5% - 1.0% ] 0.77% | 28,245 | 2.2% |
[ 0.5% - 1.0% ] 0.79% | 116,556 | 3.9% |
[ 0.5% - 1.0% ] 0.84% | 37,752 | 4.3% |
[ 0.5% - 1.0% ] 0.87% | 110,930 | 5.8% |
[ 0.5% - 1.0% ] 0.91% | 89,676 | 4.5% |
[ 0.5% - 1.0% ] 0.94% | 54,055 | 2.8% |
[ 0.5% - 1.0% ] 0.98% | 106,421 | 4.6% |
[ 1.0% - 1.5% ] 1.03% | 45,851 | 5.1% |
[ 1.0% - 1.5% ] 1.06% | 30,984 | 3.7% |
[ 1.0% - 1.5% ] 1.09% | 102,293 | 2.9% |
[ 1.0% - 1.5% ] 1.12% | 16,808 | 17.4% |
[ 1.0% - 1.5% ] 1.18% | 8,356 | 7.9% |
[ 1.0% - 1.5% ] 1.22% | 12,200 | 2.9% |
[ 1.0% - 1.5% ] 1.23% | 40,324 | 4.4% |
[ 1.0% - 1.5% ] 1.29% | 83,514 | 10.0% |
[ 1.0% - 1.5% ] 1.31% | 193,055 | 7.1% |
[ 1.0% - 1.5% ] 1.36% | 30,821 | 2.4% |
[ 1.0% - 1.5% ] 1.39% | 77,576 | 5.8% |
[ 1.0% - 1.5% ] 1.42% | 1,123 | 2.4% |
[ 1.0% - 1.5% ] 1.47% | 4,621 | 1.8% |
[ 1.5% - 2.0% ] 1.51% | 4,575 | 3.2% |
[ 1.5% - 2.0% ] 1.54% | 41,127 | 8.5% |
[ 1.5% - 2.0% ] 1.59% | 130,592 | 11.2% |
[ 1.5% - 2.0% ] 1.65% | 80,113 | 13.3% |
[ 1.5% - 2.0% ] 1.71% | 4,689 | 3.6% |
[ 1.5% - 2.0% ] 1.75% | 23,676 | 5.0% |
[ 1.5% - 2.0% ] 1.82% | 822 | 1.8% |
[ 1.5% - 2.0% ] 1.93% | 88,462 | 2.3% |
[ 1.5% - 2.0% ] 2.00% | 2,552 | 9.3% |
[ 2.0% - 2.5% ] 2.08% | 5,379 | 1.5% |
[ 2.0% - 2.5% ] 2.13% | 1,975 | 18.5% |
[ 2.0% - 2.5% ] 2.28% | 2,498 | 2.3% |
[ 2.0% - 2.5% ] 2.32% | 1,379 | 5.0% |
[ 2.0% - 2.5% ] 2.50% | 47,893 | 14.8% |
[ 2.5% - 3.0% ] 2.77% | 3,074 | 8.1% |
[ 2.5% - 3.0% ] 2.84% | 8,162 | 4.7% |
[ 3.0% - 3.5% ] 3.04% | 83,069 | 12.1% |
[ 3.5% - 4.0% ] 3.72% | 726 | 11.5% |
[ 5.5% - 6.0% ] 5.73% | 419 | 1.0% |
[ 7.0% - 7.5% ] 7.46% | 751 | 6.9% |