Immigrants from Russia Married-Couple Family Poverty

COMPARE

Immigrants from Russia
Race
Ancestry
AfghanAfricanAlaska NativeAlaskan AthabascanAlbanianAleutAlsatianAmericanApacheArabArapahoArgentineanArmenianAssyrian/Chaldean/SyriacAustralianAustrianBahamianBangladeshiBarbadianBasqueBelgianBelizeanBermudanBhutaneseBlackfeetBolivianBrazilianBritishBritish West IndianBulgarianBurmeseCajunCambodianCanadianCape VerdeanCarpatho RusynCelticCentral AmericanCentral American IndianCherokeeCheyenneChickasawChileanChineseChippewaChoctawColombianColvilleComancheCosta RicanCreeCreekCroatianCrowCubanCypriotCzechCzechoslovakianDanishDelawareDominicanDutchDutch West IndianEastern EuropeanEcuadorianEgyptianEnglishEstonianEthiopianEuropeanFijianFilipinoFinnishFrenchFrench American IndianFrench CanadianGermanGerman RussianGhanaianGreekGuamanian/ChamorroGuatemalanGuyaneseHaitianHmongHonduranHopiHoumaHungarianIcelanderIndian (Asian)IndonesianInupiatIranianIraqiIrishIroquoisIsraeliItalianJamaicanJapaneseJordanianKenyanKiowaKoreanLaotianLatvianLebaneseLiberianLithuanianLumbeeLuxembourgerMacedonianMalaysianMalteseMarshalleseMenomineeMexicanMexican American IndianMongolianMoroccanNative HawaiianNavajoNepaleseNew ZealanderNicaraguanNigerianNorthern EuropeanNorwegianOkinawanOsageOttawaPaiutePakistaniPalestinianPanamanianParaguayanPennsylvania GermanPeruvianPimaPolishPortuguesePotawatomiPuebloPuerto RicanPuget Sound SalishRomanianRussianSalvadoranSamoanScandinavianScotch-IrishScottishSeminoleSenegaleseSerbianShoshoneSierra LeoneanSiouxSlavicSlovakSloveneSomaliSouth AfricanSouth AmericanSouth American IndianSoviet UnionSpaniardSpanishSpanish AmericanSpanish American IndianSri LankanSubsaharan AfricanSudaneseSwedishSwissSyrianTaiwaneseThaiTlingit-HaidaTohono O'OdhamTonganTrinidadian and TobagonianTsimshianTurkishU.S. Virgin IslanderUgandanUkrainianUruguayanUteVenezuelanVietnameseWelshWest IndianYakamaYaquiYugoslavianYumanYup'ikZimbabwean
Immigration
NonimmigrantsImmigrantsAfghanistanAfricaAlbaniaArgentinaArmeniaAsiaAustraliaAustriaBahamasBangladeshBarbadosBelarusBelgiumBelizeBoliviaBosnia and HerzegovinaBrazilBulgariaBurma/MyanmarCabo VerdeCambodiaCameroonCanadaCaribbeanCentral AmericaChileChinaColombiaCongoCosta RicaCroatiaCubaCzechoslovakiaDenmarkDominicaDominican RepublicEastern AfricaEastern AsiaEastern EuropeEcuadorEgyptEl SalvadorEnglandEritreaEthiopiaEuropeFijiFranceGermanyGhanaGreeceGrenadaGuatemalaGuyanaHaitiHondurasHong KongHungaryIndiaIndonesiaIranIraqIrelandIsraelItalyJamaicaJapanJordanKazakhstanKenyaKoreaKuwaitLaosLatin AmericaLatviaLebanonLiberiaLithuaniaMalaysiaMexicoMicronesiaMiddle AfricaMoldovaMoroccoNepalNetherlandsNicaraguaNigeriaNorth AmericaNorth MacedoniaNorthern AfricaNorthern EuropeNorwayOceaniaPakistanPanamaPeruPhilippinesPolandPortugalRomaniaRussiaSaudi ArabiaScotlandSenegalSerbiaSierra LeoneSingaporeSomaliaSouth AfricaSouth AmericaSouth Central AsiaSouth Eastern AsiaSouthern EuropeSpainSri LankaSt. Vincent and the GrenadinesSudanSwedenSwitzerlandSyriaTaiwanThailandTrinidad and TobagoTurkeyUgandaUkraineUruguayUzbekistanVenezuelaVietnamWest IndiesWestern AfricaWestern AsiaWestern EuropeYemenZaireZimbabweAzores
Select to Compare
Race
Ancestry
AfghanAfricanAlaska NativeAlaskan AthabascanAlbanianAleutAlsatianAmericanApacheArabArapahoArgentineanArmenianAssyrian/Chaldean/SyriacAustralianAustrianBahamianBangladeshiBarbadianBasqueBelgianBelizeanBermudanBhutaneseBlackfeetBolivianBrazilianBritishBritish West IndianBulgarianBurmeseCajunCambodianCanadianCape VerdeanCarpatho RusynCelticCentral AmericanCentral American IndianCherokeeCheyenneChickasawChileanChineseChippewaChoctawColombianColvilleComancheCosta RicanCreeCreekCroatianCrowCubanCypriotCzechCzechoslovakianDanishDelawareDominicanDutchDutch West IndianEastern EuropeanEcuadorianEgyptianEnglishEstonianEthiopianEuropeanFijianFilipinoFinnishFrenchFrench American IndianFrench CanadianGermanGerman RussianGhanaianGreekGuamanian/ChamorroGuatemalanGuyaneseHaitianHmongHonduranHopiHoumaHungarianIcelanderIndian (Asian)IndonesianInupiatIranianIraqiIrishIroquoisIsraeliItalianJamaicanJapaneseJordanianKenyanKiowaKoreanLaotianLatvianLebaneseLiberianLithuanianLumbeeLuxembourgerMacedonianMalaysianMalteseMarshalleseMenomineeMexicanMexican American IndianMongolianMoroccanNative HawaiianNavajoNepaleseNew ZealanderNicaraguanNigerianNorthern EuropeanNorwegianOkinawanOsageOttawaPaiutePakistaniPalestinianPanamanianParaguayanPennsylvania GermanPeruvianPimaPolishPortuguesePotawatomiPuebloPuerto RicanPuget Sound SalishRomanianRussianSalvadoranSamoanScandinavianScotch-IrishScottishSeminoleSenegaleseSerbianShoshoneSierra LeoneanSiouxSlavicSlovakSloveneSomaliSouth AfricanSouth AmericanSouth American IndianSoviet UnionSpaniardSpanishSpanish AmericanSpanish American IndianSri LankanSubsaharan AfricanSudaneseSwedishSwissSyrianTaiwaneseThaiTlingit-HaidaTohono O'OdhamTonganTrinidadian and TobagonianTsimshianTurkishU.S. Virgin IslanderUgandanUkrainianUruguayanUteVenezuelanVietnameseWelshWest IndianYakamaYaquiYugoslavianYumanYup'ikZimbabwean
Immigration
NonimmigrantsImmigrantsAfghanistanAfricaAlbaniaArgentinaArmeniaAsiaAustraliaAustriaBahamasBangladeshBarbadosBelarusBelgiumBelizeBoliviaBosnia and HerzegovinaBrazilBulgariaBurma/MyanmarCabo VerdeCambodiaCameroonCanadaCaribbeanCentral AmericaChileChinaColombiaCongoCosta RicaCroatiaCubaCzechoslovakiaDenmarkDominicaDominican RepublicEastern AfricaEastern AsiaEastern EuropeEcuadorEgyptEl SalvadorEnglandEritreaEthiopiaEuropeFijiFranceGermanyGhanaGreeceGrenadaGuatemalaGuyanaHaitiHondurasHong KongHungaryIndiaIndonesiaIranIraqIrelandIsraelItalyJamaicaJapanJordanKazakhstanKenyaKoreaKuwaitLaosLatin AmericaLatviaLebanonLiberiaLithuaniaMalaysiaMexicoMicronesiaMiddle AfricaMoldovaMoroccoNepalNetherlandsNicaraguaNigeriaNorth AmericaNorth MacedoniaNorthern AfricaNorthern EuropeNorwayOceaniaPakistanPanamaPeruPhilippinesPolandPortugalRomaniaSaudi ArabiaScotlandSenegalSerbiaSierra LeoneSingaporeSomaliaSouth AfricaSouth AmericaSouth Central AsiaSouth Eastern AsiaSouthern EuropeSpainSri LankaSt. Vincent and the GrenadinesSudanSwedenSwitzerlandSyriaTaiwanThailandTrinidad and TobagoTurkeyUgandaUkraineUruguayUzbekistanVenezuelaVietnamWest IndiesWestern AfricaWestern AsiaWestern EuropeYemenZaireZimbabweAzores
Married-Couple Family Poverty
Income
Poverty
Unemployment
Labor Participation
Family Structure
Vehicle Availability
Education Level
Disability

Immigrants from Russia Married-Couple Family Poverty
Good

5.0%
POVERTY | MARRIED-COUPLE FAMILIES
78.7/ 100
METRIC RATING
148th/ 347
METRIC RANK

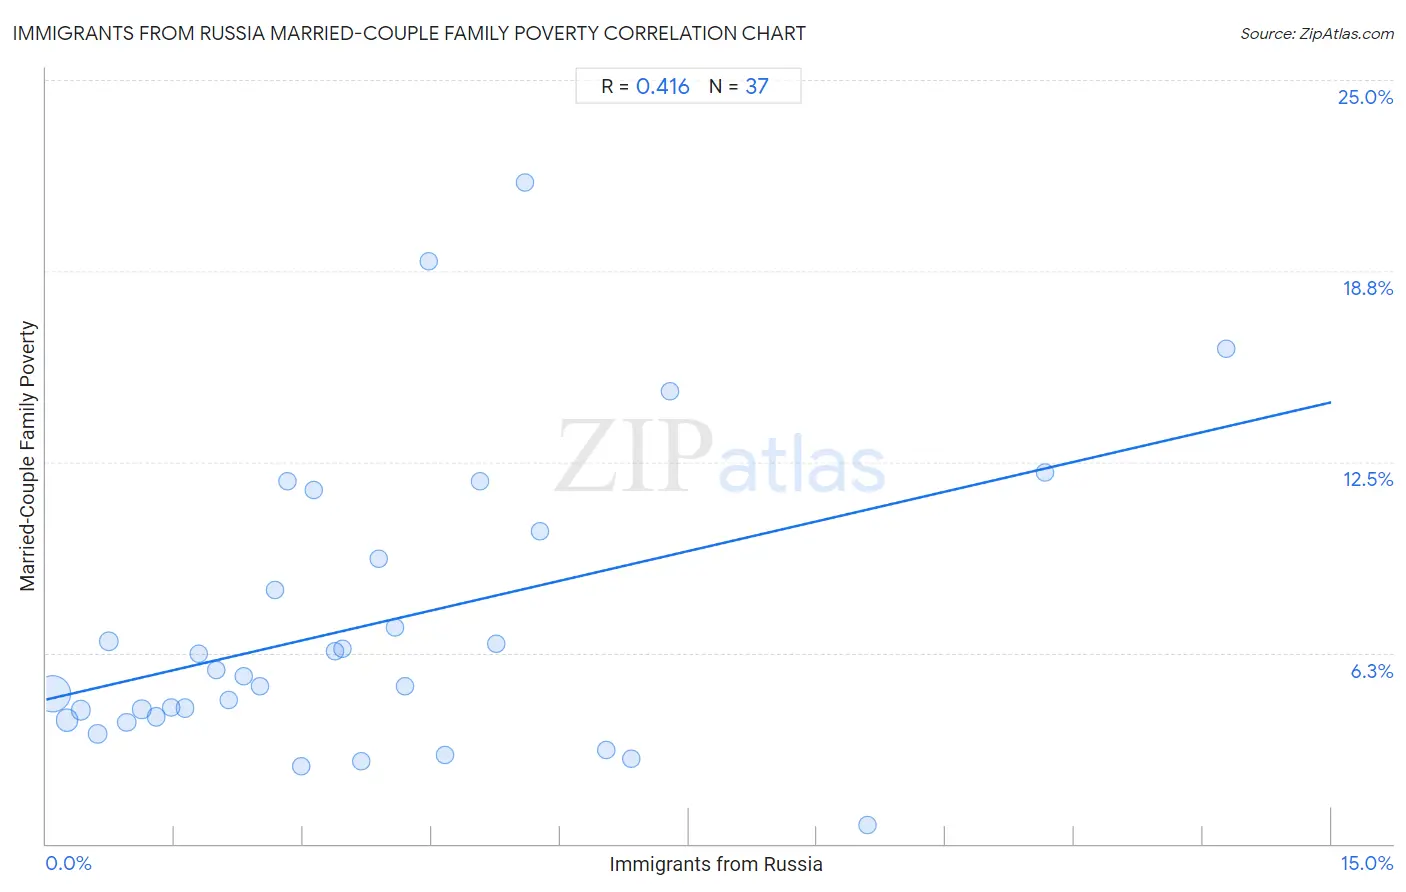
Immigrants from Russia Married-Couple Family Poverty Correlation Chart

The statistical analysis conducted on geographies consisting of 344,976,831 people shows a moderate positive correlation between the proportion of Immigrants from Russia and poverty level among married-couple families in the United States with a correlation coefficient (R) of 0.416 and weighted average of 5.0%. On average, for every 1% (one percent) increase in Immigrants from Russia within a typical geography, there is an increase of 0.65% in poverty level among married-couple families.
Immigrants from Russia Married-Couple Family Poverty
It is essential to understand that the correlation between the percentage of Immigrants from Russia and poverty level among married-couple families does not imply a direct cause-and-effect relationship. It remains uncertain whether the presence of Immigrants from Russia influences an upward or downward trend in the level of poverty level among married-couple families within an area, or if Immigrants from Russia simply ended up residing in those areas with higher or lower levels of poverty level among married-couple families due to other factors.

Demographics Similar to Immigrants from Russia by Married-Couple Family Poverty

In terms of married-couple family poverty, the demographic groups most similar to Immigrants from Russia are Syrian (5.0%, a difference of 0.0%), Immigrants from Oceania (5.0%, a difference of 0.030%), Brazilian (5.0%, a difference of 0.080%), Mongolian (5.0%, a difference of 0.20%), and Immigrants from Spain (5.0%, a difference of 0.21%).
DemographicsRating | RankMarried-Couple Family Poverty
Immigrants from Brazil
84.6
/100
|
#141
Excellent
5.0%
Immigrants from China
84.6
/100
|
#142
Excellent
5.0%
Immigrants from Egypt
83.4
/100
|
#143
Excellent
5.0%
Hmong
83.2
/100
|
#144
Excellent
5.0%
Immigrants from Spain
79.9
/100
|
#145
Good
5.0%
Mongolians
79.8
/100
|
#146
Good
5.0%
Syrians
78.7
/100
|
#147
Good
5.0%
Immigrants from Russia
78.7
/100
|
#148
Good
5.0%
Immigrants from Oceania
78.6
/100
|
#149
Good
5.0%
Brazilians
78.3
/100
|
#150
Good
5.0%
Immigrants from Cameroon
77.3
/100
|
#151
Good
5.0%
Albanians
77.2
/100
|
#152
Good
5.0%
Immigrants from Kuwait
76.3
/100
|
#153
Good
5.0%
Delaware
73.7
/100
|
#154
Good
5.1%
Immigrants from Ethiopia
72.4
/100
|
#155
Good
5.1%

Immigrants from Russia Married-Couple Family Poverty Correlation Summary

MeasurementImmigrants from Russia DataMarried-Couple Family Poverty Data
Minimum0.071%0.60%
Maximum13.8%21.6%
Range13.7%21.0%
Mean3.8%7.2%
Median3.1%5.5%
Interquartile 25% (IQ1)1.5%4.1%
Interquartile 75% (IQ3)5.2%9.8%
Interquartile Range (IQR)3.6%5.7%
Standard Deviation (Sample)3.1%4.8%
Standard Deviation (Population)3.0%4.7%

Correlation Details

Immigrants from Russia PercentileSample SizeMarried-Couple Family Poverty
[
0.0%
-
0.5%
]
0.071%
226,635,8104.9%
[
0.0%
-
0.5%
]
0.24%
56,084,9154.1%
[
0.0%
-
0.5%
]
0.40%
25,264,5814.4%
[
0.5%
-
1.0%
]
0.60%
12,424,4603.6%
[
0.5%
-
1.0%
]
0.73%
14,224,9406.6%
[
0.5%
-
1.0%
]
0.94%
3,176,2774.0%
[
1.0%
-
1.5%
]
1.12%
1,837,8484.4%
[
1.0%
-
1.5%
]
1.28%
1,470,0414.2%
[
1.0%
-
1.5%
]
1.45%
1,109,1614.5%
[
1.5%
-
2.0%
]
1.62%
705,4774.4%
[
1.5%
-
2.0%
]
1.78%
263,9726.2%
[
1.5%
-
2.0%
]
1.99%
216,8365.7%
[
2.0%
-
2.5%
]
2.13%
260,5834.7%
[
2.0%
-
2.5%
]
2.30%
143,2315.5%
[
2.0%
-
2.5%
]
2.49%
112,8055.1%
[
2.5%
-
3.0%
]
2.67%
168,9518.3%
[
2.5%
-
3.0%
]
2.81%
256,71911.9%
[
2.5%
-
3.0%
]
2.97%
129,9622.5%
[
3.0%
-
3.5%
]
3.12%
128,12511.6%
[
3.0%
-
3.5%
]
3.38%
11,4626.3%
[
3.0%
-
3.5%
]
3.46%
51,5496.4%
[
3.5%
-
4.0%
]
3.67%
8,0552.7%
[
3.5%
-
4.0%
]
3.89%
2,0589.3%
[
4.0%
-
4.5%
]
4.07%
22,1407.1%
[
4.0%
-
4.5%
]
4.19%
14,9035.2%
[
4.0%
-
4.5%
]
4.47%
17919.0%
[
4.5%
-
5.0%
]
4.66%
1,1382.9%
[
5.0%
-
5.5%
]
5.06%
8,70711.9%
[
5.0%
-
5.5%
]
5.25%
22,2026.5%
[
5.5%
-
6.0%
]
5.58%
2,70421.6%
[
5.5%
-
6.0%
]
5.77%
81,10910.2%
[
6.5%
-
7.0%
]
6.53%
1,9903.1%
[
6.5%
-
7.0%
]
6.83%
1,3182.8%
[
7.0%
-
7.5%
]
7.28%
47,89314.8%
[
9.5%
-
10.0%
]
9.59%
1,5230.60%
[
11.5%
-
12.0%
]
11.66%
83,06912.1%
[
13.5%
-
14.0%
]
13.77%
13816.2%