Immigrants from Romania GED/Equivalency
COMPARE
Immigrants from Romania
Select to Compare
GED/Equivalency
Immigrants from Romania GED/Equivalency
87.5%
GED/EQUIVALENCY
98.1/ 100
METRIC RATING
84th/ 347
METRIC RANK
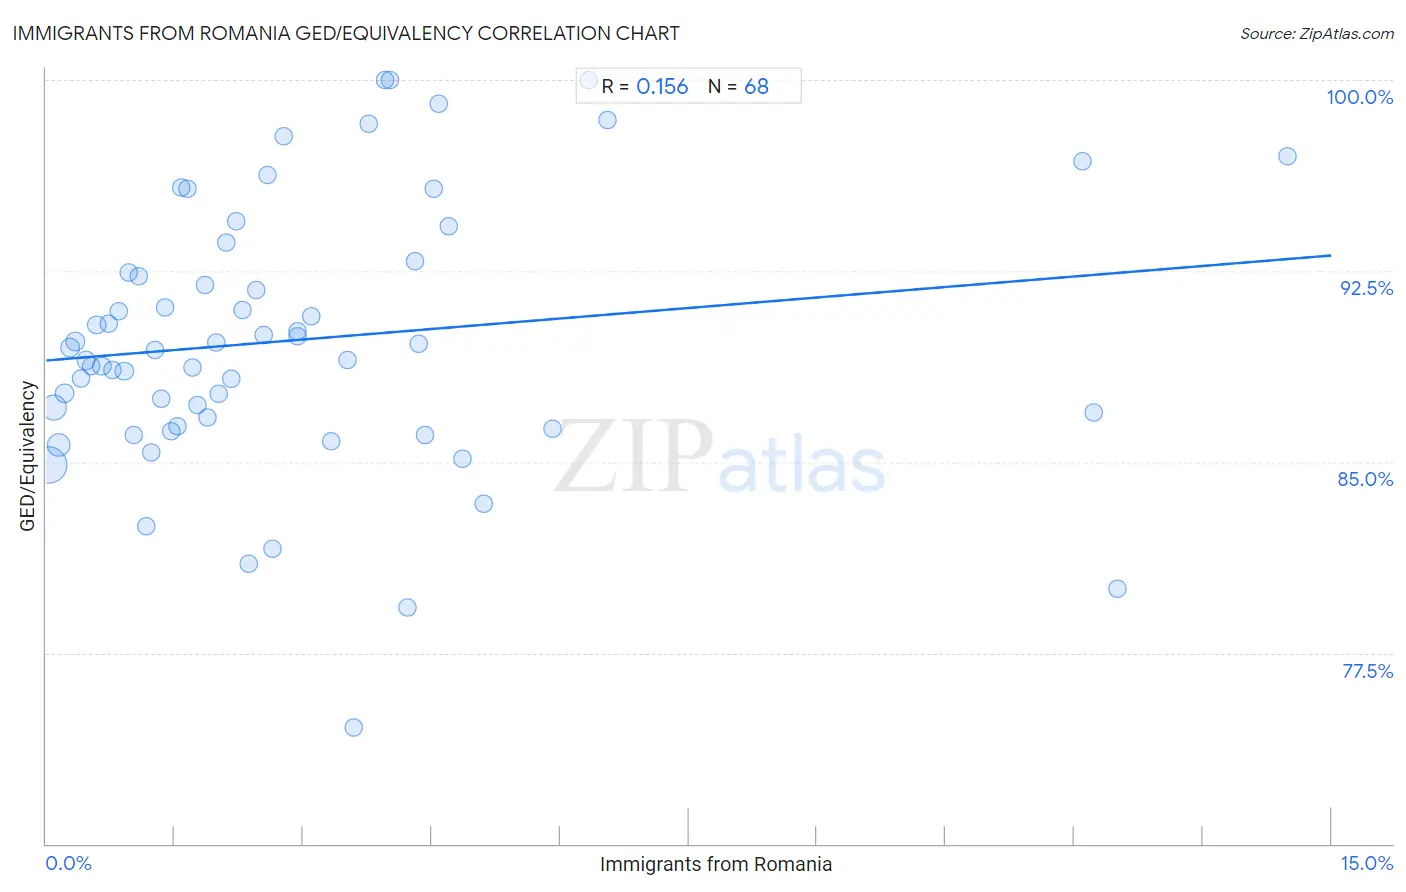
Immigrants from Romania GED/Equivalency Correlation Chart
The statistical analysis conducted on geographies consisting of 257,013,054 people shows a poor positive correlation between the proportion of Immigrants from Romania and percentage of population with at least ged/equivalency education in the United States with a correlation coefficient (R) of 0.156 and weighted average of 87.5%. On average, for every 1% (one percent) increase in Immigrants from Romania within a typical geography, there is an increase of 0.28% in percentage of population with at least ged/equivalency education.
It is essential to understand that the correlation between the percentage of Immigrants from Romania and percentage of population with at least ged/equivalency education does not imply a direct cause-and-effect relationship. It remains uncertain whether the presence of Immigrants from Romania influences an upward or downward trend in the level of percentage of population with at least ged/equivalency education within an area, or if Immigrants from Romania simply ended up residing in those areas with higher or lower levels of percentage of population with at least ged/equivalency education due to other factors.
Demographics Similar to Immigrants from Romania by GED/Equivalency
In terms of ged/equivalency, the demographic groups most similar to Immigrants from Romania are Dutch (87.5%, a difference of 0.0%), Immigrants from Europe (87.5%, a difference of 0.010%), Native Hawaiian (87.5%, a difference of 0.010%), Immigrants from Norway (87.5%, a difference of 0.020%), and South African (87.5%, a difference of 0.040%).
| Demographics | Rating | Rank | GED/Equivalency |
| Slavs | 98.7 /100 | #77 | Exceptional 87.7% |
| Irish | 98.6 /100 | #78 | Exceptional 87.6% |
| English | 98.6 /100 | #79 | Exceptional 87.6% |
| Immigrants from England | 98.5 /100 | #80 | Exceptional 87.6% |
| Immigrants from Sri Lanka | 98.3 /100 | #81 | Exceptional 87.5% |
| Romanians | 98.3 /100 | #82 | Exceptional 87.5% |
| South Africans | 98.3 /100 | #83 | Exceptional 87.5% |
| Immigrants from Romania | 98.1 /100 | #84 | Exceptional 87.5% |
| Dutch | 98.1 /100 | #85 | Exceptional 87.5% |
| Immigrants from Europe | 98.1 /100 | #86 | Exceptional 87.5% |
| Native Hawaiians | 98.1 /100 | #87 | Exceptional 87.5% |
| Immigrants from Norway | 98.1 /100 | #88 | Exceptional 87.5% |
| Hungarians | 97.9 /100 | #89 | Exceptional 87.4% |
| Welsh | 97.9 /100 | #90 | Exceptional 87.4% |
| Immigrants from Eastern Asia | 97.9 /100 | #91 | Exceptional 87.4% |
Immigrants from Romania GED/Equivalency Correlation Summary
| Measurement | Immigrants from Romania Data | GED/Equivalency Data |
| Minimum | 0.030% | 74.6% |
| Maximum | 14.5% | 100.0% |
| Range | 14.5% | 25.4% |
| Mean | 2.9% | 89.8% |
| Median | 2.1% | 89.4% |
| Interquartile 25% (IQ1) | 1.1% | 86.6% |
| Interquartile 75% (IQ3) | 4.0% | 92.7% |
| Interquartile Range (IQR) | 2.9% | 6.1% |
| Standard Deviation (Sample) | 3.0% | 5.3% |
| Standard Deviation (Population) | 3.0% | 5.2% |
Correlation Details
| Immigrants from Romania Percentile | Sample Size | GED/Equivalency |
[ 0.0% - 0.5% ] 0.030% | 129,813,154 | 84.9% |
[ 0.0% - 0.5% ] 0.089% | 50,827,956 | 87.1% |
[ 0.0% - 0.5% ] 0.15% | 35,130,049 | 85.7% |
[ 0.0% - 0.5% ] 0.21% | 15,178,101 | 87.7% |
[ 0.0% - 0.5% ] 0.28% | 7,232,485 | 89.5% |
[ 0.0% - 0.5% ] 0.34% | 5,117,268 | 89.7% |
[ 0.0% - 0.5% ] 0.40% | 3,618,706 | 88.3% |
[ 0.0% - 0.5% ] 0.46% | 2,247,268 | 89.0% |
[ 0.5% - 1.0% ] 0.52% | 1,759,971 | 88.8% |
[ 0.5% - 1.0% ] 0.59% | 1,532,035 | 90.4% |
[ 0.5% - 1.0% ] 0.65% | 768,163 | 88.7% |
[ 0.5% - 1.0% ] 0.72% | 624,238 | 90.4% |
[ 0.5% - 1.0% ] 0.78% | 690,550 | 88.6% |
[ 0.5% - 1.0% ] 0.85% | 293,064 | 90.9% |
[ 0.5% - 1.0% ] 0.91% | 523,522 | 88.6% |
[ 0.5% - 1.0% ] 0.97% | 274,214 | 92.5% |
[ 1.0% - 1.5% ] 1.03% | 114,945 | 86.1% |
[ 1.0% - 1.5% ] 1.09% | 132,567 | 92.3% |
[ 1.0% - 1.5% ] 1.17% | 77,806 | 82.5% |
[ 1.0% - 1.5% ] 1.23% | 192,074 | 85.4% |
[ 1.0% - 1.5% ] 1.27% | 50,767 | 89.4% |
[ 1.0% - 1.5% ] 1.34% | 181,360 | 87.5% |
[ 1.0% - 1.5% ] 1.39% | 52,825 | 91.1% |
[ 1.0% - 1.5% ] 1.46% | 54,250 | 86.2% |
[ 1.5% - 2.0% ] 1.54% | 36,802 | 86.4% |
[ 1.5% - 2.0% ] 1.57% | 6,667 | 95.8% |
[ 1.5% - 2.0% ] 1.65% | 12,050 | 95.7% |
[ 1.5% - 2.0% ] 1.70% | 7,232 | 88.7% |
[ 1.5% - 2.0% ] 1.76% | 66,164 | 87.2% |
[ 1.5% - 2.0% ] 1.85% | 7,828 | 92.0% |
[ 1.5% - 2.0% ] 1.89% | 93,713 | 86.8% |
[ 1.5% - 2.0% ] 1.98% | 63,866 | 89.7% |
[ 2.0% - 2.5% ] 2.02% | 65,890 | 87.7% |
[ 2.0% - 2.5% ] 2.10% | 11,056 | 93.6% |
[ 2.0% - 2.5% ] 2.15% | 41,134 | 88.3% |
[ 2.0% - 2.5% ] 2.21% | 11,062 | 94.4% |
[ 2.0% - 2.5% ] 2.29% | 523 | 91.0% |
[ 2.0% - 2.5% ] 2.36% | 2,369 | 81.0% |
[ 2.0% - 2.5% ] 2.46% | 27,951 | 91.7% |
[ 2.5% - 3.0% ] 2.54% | 14,652 | 90.0% |
[ 2.5% - 3.0% ] 2.58% | 1,125 | 96.3% |
[ 2.5% - 3.0% ] 2.65% | 1,814 | 81.6% |
[ 2.5% - 3.0% ] 2.77% | 1,048 | 97.8% |
[ 2.5% - 3.0% ] 2.93% | 852 | 89.9% |
[ 2.5% - 3.0% ] 2.94% | 26,939 | 90.1% |
[ 3.0% - 3.5% ] 3.10% | 1,194 | 90.7% |
[ 3.0% - 3.5% ] 3.33% | 3,064 | 85.8% |
[ 3.5% - 4.0% ] 3.52% | 426 | 89.0% |
[ 3.5% - 4.0% ] 3.59% | 390 | 74.6% |
[ 3.5% - 4.0% ] 3.77% | 2,812 | 98.3% |
[ 3.5% - 4.0% ] 3.95% | 1,899 | 100.0% |
[ 4.0% - 4.5% ] 4.01% | 673 | 100.0% |
[ 4.0% - 4.5% ] 4.21% | 5,555 | 79.3% |
[ 4.0% - 4.5% ] 4.31% | 116 | 92.9% |
[ 4.0% - 4.5% ] 4.35% | 69 | 89.7% |
[ 4.0% - 4.5% ] 4.42% | 1,153 | 86.1% |
[ 4.5% - 5.0% ] 4.52% | 974 | 95.7% |
[ 4.5% - 5.0% ] 4.59% | 676 | 99.0% |
[ 4.5% - 5.0% ] 4.70% | 532 | 94.3% |
[ 4.5% - 5.0% ] 4.85% | 515 | 85.1% |
[ 5.0% - 5.5% ] 5.10% | 98 | 83.3% |
[ 5.5% - 6.0% ] 5.91% | 203 | 86.3% |
[ 6.0% - 6.5% ] 6.33% | 411 | 100.0% |
[ 6.5% - 7.0% ] 6.55% | 412 | 98.4% |
[ 12.0% - 12.5% ] 12.10% | 1,885 | 96.8% |
[ 12.0% - 12.5% ] 12.23% | 1,668 | 86.9% |
[ 12.0% - 12.5% ] 12.50% | 40 | 80.0% |
[ 14.0% - 14.5% ] 14.49% | 214 | 97.0% |