Immigrants from Czechoslovakia GED/Equivalency
COMPARE
Immigrants from Czechoslovakia
Select to Compare
GED/Equivalency
Immigrants from Czechoslovakia GED/Equivalency
87.9%
GED/EQUIVALENCY
99.3/ 100
METRIC RATING
57th/ 347
METRIC RANK
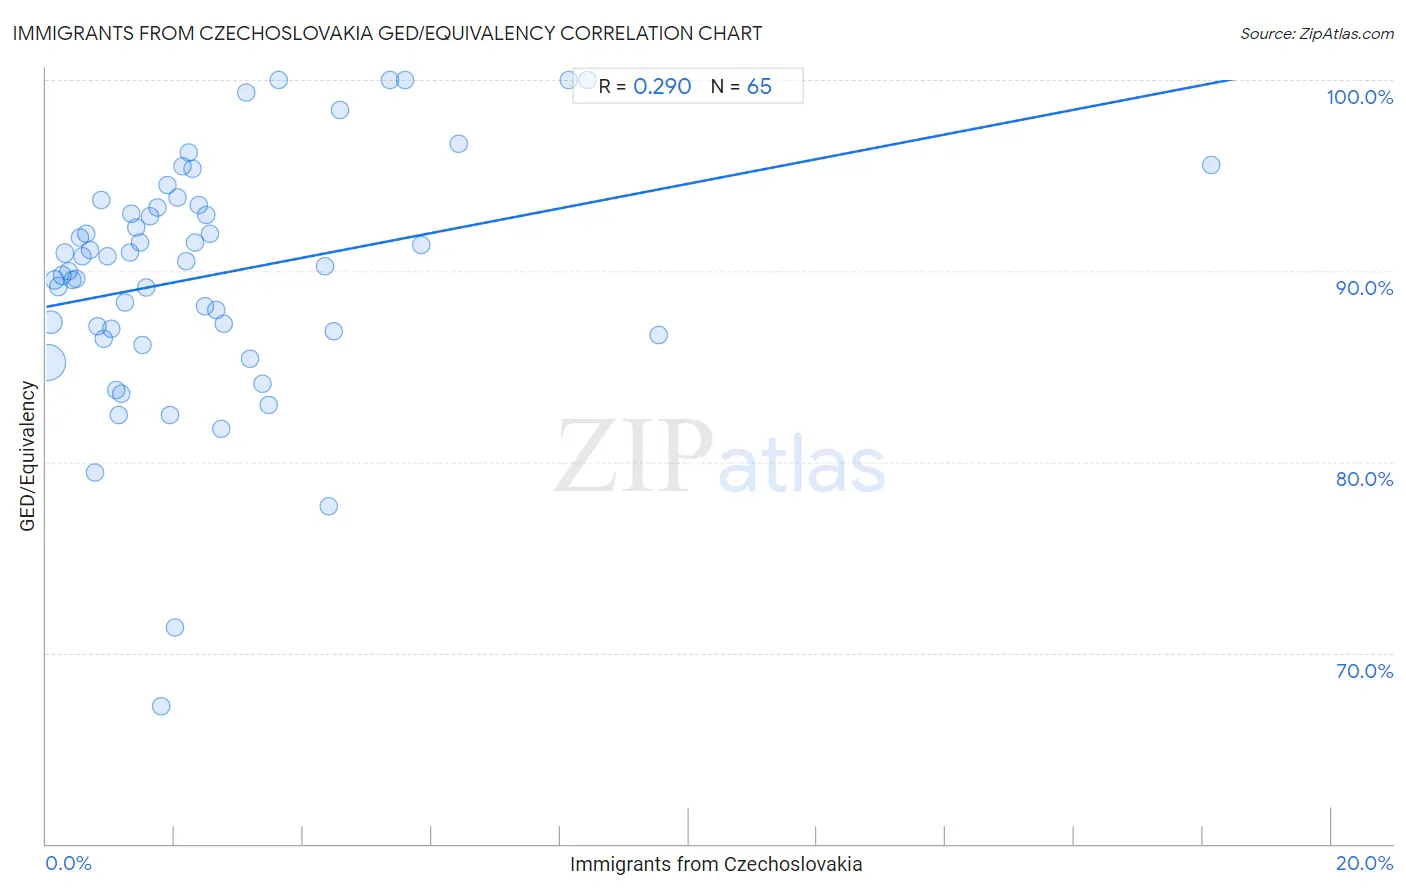
Immigrants from Czechoslovakia GED/Equivalency Correlation Chart
The statistical analysis conducted on geographies consisting of 195,448,106 people shows a weak positive correlation between the proportion of Immigrants from Czechoslovakia and percentage of population with at least ged/equivalency education in the United States with a correlation coefficient (R) of 0.290 and weighted average of 87.9%. On average, for every 1% (one percent) increase in Immigrants from Czechoslovakia within a typical geography, there is an increase of 0.65% in percentage of population with at least ged/equivalency education.
It is essential to understand that the correlation between the percentage of Immigrants from Czechoslovakia and percentage of population with at least ged/equivalency education does not imply a direct cause-and-effect relationship. It remains uncertain whether the presence of Immigrants from Czechoslovakia influences an upward or downward trend in the level of percentage of population with at least ged/equivalency education within an area, or if Immigrants from Czechoslovakia simply ended up residing in those areas with higher or lower levels of percentage of population with at least ged/equivalency education due to other factors.
Demographics Similar to Immigrants from Czechoslovakia by GED/Equivalency
In terms of ged/equivalency, the demographic groups most similar to Immigrants from Czechoslovakia are Northern European (87.9%, a difference of 0.0%), Serbian (87.9%, a difference of 0.010%), Scandinavian (87.9%, a difference of 0.020%), European (87.9%, a difference of 0.020%), and German (87.9%, a difference of 0.040%).
| Demographics | Rating | Rank | GED/Equivalency |
| Immigrants from Korea | 99.5 /100 | #50 | Exceptional 88.1% |
| Immigrants from Netherlands | 99.4 /100 | #51 | Exceptional 88.0% |
| Zimbabweans | 99.4 /100 | #52 | Exceptional 88.0% |
| Immigrants from South Africa | 99.4 /100 | #53 | Exceptional 88.0% |
| Soviet Union | 99.4 /100 | #54 | Exceptional 88.0% |
| New Zealanders | 99.4 /100 | #55 | Exceptional 88.0% |
| Immigrants from Denmark | 99.4 /100 | #56 | Exceptional 88.0% |
| Immigrants from Czechoslovakia | 99.3 /100 | #57 | Exceptional 87.9% |
| Northern Europeans | 99.3 /100 | #58 | Exceptional 87.9% |
| Serbians | 99.3 /100 | #59 | Exceptional 87.9% |
| Scandinavians | 99.3 /100 | #60 | Exceptional 87.9% |
| Europeans | 99.3 /100 | #61 | Exceptional 87.9% |
| Germans | 99.3 /100 | #62 | Exceptional 87.9% |
| Immigrants from Turkey | 99.2 /100 | #63 | Exceptional 87.9% |
| Immigrants from Canada | 99.2 /100 | #64 | Exceptional 87.9% |
Immigrants from Czechoslovakia GED/Equivalency Correlation Summary
| Measurement | Immigrants from Czechoslovakia Data | GED/Equivalency Data |
| Minimum | 0.022% | 67.2% |
| Maximum | 18.1% | 100.0% |
| Range | 18.1% | 32.8% |
| Mean | 2.6% | 89.8% |
| Median | 1.9% | 90.5% |
| Interquartile 25% (IQ1) | 0.87% | 86.7% |
| Interquartile 75% (IQ3) | 3.1% | 93.4% |
| Interquartile Range (IQR) | 2.3% | 6.6% |
| Standard Deviation (Sample) | 2.8% | 6.3% |
| Standard Deviation (Population) | 2.8% | 6.3% |
Correlation Details
| Immigrants from Czechoslovakia Percentile | Sample Size | GED/Equivalency |
[ 0.0% - 0.5% ] 0.022% | 130,946,311 | 85.2% |
[ 0.0% - 0.5% ] 0.073% | 39,414,296 | 87.3% |
[ 0.0% - 0.5% ] 0.13% | 11,221,197 | 89.5% |
[ 0.0% - 0.5% ] 0.19% | 5,209,777 | 89.2% |
[ 0.0% - 0.5% ] 0.25% | 3,101,532 | 89.8% |
[ 0.0% - 0.5% ] 0.30% | 1,517,285 | 90.9% |
[ 0.0% - 0.5% ] 0.36% | 1,263,015 | 90.0% |
[ 0.0% - 0.5% ] 0.41% | 613,737 | 89.5% |
[ 0.0% - 0.5% ] 0.46% | 438,835 | 89.6% |
[ 0.5% - 1.0% ] 0.52% | 377,704 | 91.7% |
[ 0.5% - 1.0% ] 0.57% | 276,746 | 90.8% |
[ 0.5% - 1.0% ] 0.62% | 287,974 | 92.0% |
[ 0.5% - 1.0% ] 0.68% | 96,067 | 91.1% |
[ 0.5% - 1.0% ] 0.75% | 127,463 | 79.4% |
[ 0.5% - 1.0% ] 0.80% | 73,297 | 87.1% |
[ 0.5% - 1.0% ] 0.85% | 13,000 | 93.7% |
[ 0.5% - 1.0% ] 0.90% | 128,232 | 86.4% |
[ 0.5% - 1.0% ] 0.95% | 41,413 | 90.7% |
[ 1.0% - 1.5% ] 1.01% | 39,657 | 87.0% |
[ 1.0% - 1.5% ] 1.08% | 32,075 | 83.8% |
[ 1.0% - 1.5% ] 1.13% | 19,747 | 82.5% |
[ 1.0% - 1.5% ] 1.17% | 29,269 | 83.5% |
[ 1.0% - 1.5% ] 1.23% | 21,542 | 88.3% |
[ 1.0% - 1.5% ] 1.30% | 31,003 | 90.9% |
[ 1.0% - 1.5% ] 1.33% | 8,415 | 93.0% |
[ 1.0% - 1.5% ] 1.40% | 19,723 | 92.3% |
[ 1.0% - 1.5% ] 1.45% | 3,104 | 91.5% |
[ 1.0% - 1.5% ] 1.50% | 10,027 | 86.1% |
[ 1.5% - 2.0% ] 1.55% | 902 | 89.1% |
[ 1.5% - 2.0% ] 1.62% | 27,614 | 92.9% |
[ 1.5% - 2.0% ] 1.74% | 5,413 | 93.3% |
[ 1.5% - 2.0% ] 1.79% | 782 | 67.2% |
[ 1.5% - 2.0% ] 1.89% | 1,689 | 94.5% |
[ 1.5% - 2.0% ] 1.94% | 5,064 | 82.5% |
[ 1.5% - 2.0% ] 2.00% | 2,854 | 71.3% |
[ 2.0% - 2.5% ] 2.03% | 2,704 | 93.9% |
[ 2.0% - 2.5% ] 2.11% | 2,460 | 95.5% |
[ 2.0% - 2.5% ] 2.18% | 1,975 | 90.5% |
[ 2.0% - 2.5% ] 2.22% | 721 | 96.2% |
[ 2.0% - 2.5% ] 2.28% | 1,317 | 95.4% |
[ 2.0% - 2.5% ] 2.32% | 691 | 91.5% |
[ 2.0% - 2.5% ] 2.38% | 210 | 93.5% |
[ 2.0% - 2.5% ] 2.46% | 2,436 | 88.1% |
[ 2.0% - 2.5% ] 2.50% | 1,763 | 92.9% |
[ 2.5% - 3.0% ] 2.54% | 4,135 | 92.0% |
[ 2.5% - 3.0% ] 2.65% | 1,246 | 87.9% |
[ 2.5% - 3.0% ] 2.73% | 1,686 | 81.7% |
[ 2.5% - 3.0% ] 2.76% | 3,664 | 87.2% |
[ 3.0% - 3.5% ] 3.12% | 642 | 99.3% |
[ 3.0% - 3.5% ] 3.17% | 6,019 | 85.4% |
[ 3.0% - 3.5% ] 3.36% | 417 | 84.1% |
[ 3.0% - 3.5% ] 3.46% | 1,272 | 83.0% |
[ 3.5% - 4.0% ] 3.62% | 995 | 100.0% |
[ 4.0% - 4.5% ] 4.35% | 115 | 90.3% |
[ 4.0% - 4.5% ] 4.39% | 296 | 77.7% |
[ 4.0% - 4.5% ] 4.48% | 223 | 86.9% |
[ 4.5% - 5.0% ] 4.58% | 1,289 | 98.4% |
[ 5.0% - 5.5% ] 5.35% | 355 | 100.0% |
[ 5.5% - 6.0% ] 5.58% | 197 | 100.0% |
[ 5.5% - 6.0% ] 5.84% | 2,002 | 91.4% |
[ 6.0% - 6.5% ] 6.42% | 1,636 | 96.7% |
[ 8.0% - 8.5% ] 8.14% | 86 | 100.0% |
[ 8.0% - 8.5% ] 8.43% | 83 | 100.0% |
[ 9.5% - 10.0% ] 9.54% | 346 | 86.6% |
[ 18.0% - 18.5% ] 18.13% | 364 | 95.5% |