Immigrants from Venezuela GED/Equivalency
COMPARE
Immigrants from Venezuela
Select to Compare
GED/Equivalency
Immigrants from Venezuela GED/Equivalency
85.8%
GED/EQUIVALENCY
50.7/ 100
METRIC RATING
173rd/ 347
METRIC RANK
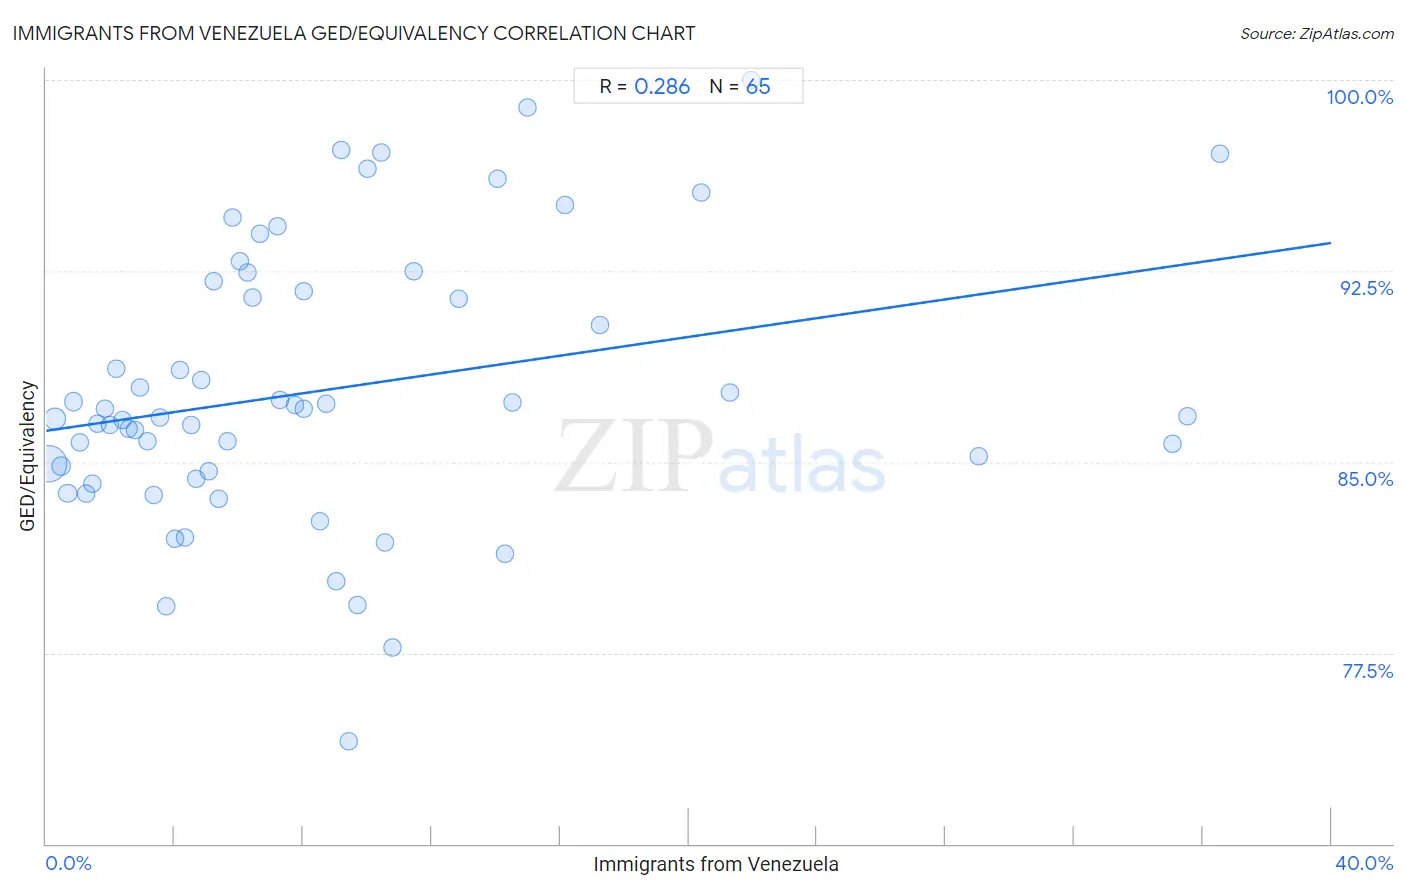
Immigrants from Venezuela GED/Equivalency Correlation Chart
The statistical analysis conducted on geographies consisting of 287,866,009 people shows a weak positive correlation between the proportion of Immigrants from Venezuela and percentage of population with at least ged/equivalency education in the United States with a correlation coefficient (R) of 0.286 and weighted average of 85.8%. On average, for every 1% (one percent) increase in Immigrants from Venezuela within a typical geography, there is an increase of 0.18% in percentage of population with at least ged/equivalency education.
It is essential to understand that the correlation between the percentage of Immigrants from Venezuela and percentage of population with at least ged/equivalency education does not imply a direct cause-and-effect relationship. It remains uncertain whether the presence of Immigrants from Venezuela influences an upward or downward trend in the level of percentage of population with at least ged/equivalency education within an area, or if Immigrants from Venezuela simply ended up residing in those areas with higher or lower levels of percentage of population with at least ged/equivalency education due to other factors.
Demographics Similar to Immigrants from Venezuela by GED/Equivalency
In terms of ged/equivalency, the demographic groups most similar to Immigrants from Venezuela are Ottawa (85.8%, a difference of 0.010%), Immigrants from Bolivia (85.8%, a difference of 0.020%), Immigrants from Eastern Africa (85.7%, a difference of 0.060%), Bermudan (85.8%, a difference of 0.090%), and Immigrants from Uganda (85.7%, a difference of 0.11%).
| Demographics | Rating | Rank | GED/Equivalency |
| Immigrants from Albania | 64.2 /100 | #166 | Good 86.0% |
| Ethiopians | 63.7 /100 | #167 | Good 86.0% |
| Sierra Leoneans | 61.8 /100 | #168 | Good 86.0% |
| Immigrants from Ethiopia | 61.2 /100 | #169 | Good 86.0% |
| Afghans | 59.7 /100 | #170 | Average 85.9% |
| Immigrants from Chile | 57.3 /100 | #171 | Average 85.9% |
| Bermudans | 55.1 /100 | #172 | Average 85.8% |
| Immigrants from Venezuela | 50.7 /100 | #173 | Average 85.8% |
| Ottawa | 50.0 /100 | #174 | Average 85.8% |
| Immigrants from Bolivia | 49.8 /100 | #175 | Average 85.8% |
| Immigrants from Eastern Africa | 47.7 /100 | #176 | Average 85.7% |
| Immigrants from Uganda | 45.2 /100 | #177 | Average 85.7% |
| Koreans | 41.2 /100 | #178 | Average 85.6% |
| Aleuts | 40.5 /100 | #179 | Average 85.6% |
| Immigrants from Southern Europe | 38.4 /100 | #180 | Fair 85.5% |
Immigrants from Venezuela GED/Equivalency Correlation Summary
| Measurement | Immigrants from Venezuela Data | GED/Equivalency Data |
| Minimum | 0.077% | 74.0% |
| Maximum | 36.5% | 100.0% |
| Range | 36.5% | 26.0% |
| Mean | 8.7% | 87.8% |
| Median | 6.3% | 86.8% |
| Interquartile 25% (IQ1) | 3.0% | 84.5% |
| Interquartile 75% (IQ3) | 10.7% | 91.9% |
| Interquartile Range (IQR) | 7.6% | 7.4% |
| Standard Deviation (Sample) | 8.4% | 5.4% |
| Standard Deviation (Population) | 8.3% | 5.4% |
Correlation Details
| Immigrants from Venezuela Percentile | Sample Size | GED/Equivalency |
[ 0.0% - 0.5% ] 0.077% | 198,558,883 | 84.9% |
[ 0.0% - 0.5% ] 0.27% | 40,797,462 | 86.7% |
[ 0.0% - 0.5% ] 0.46% | 16,519,033 | 84.8% |
[ 0.5% - 1.0% ] 0.67% | 9,337,990 | 83.8% |
[ 0.5% - 1.0% ] 0.85% | 4,948,313 | 87.4% |
[ 1.0% - 1.5% ] 1.03% | 2,695,417 | 85.8% |
[ 1.0% - 1.5% ] 1.24% | 2,633,329 | 83.8% |
[ 1.0% - 1.5% ] 1.43% | 1,753,051 | 84.1% |
[ 1.5% - 2.0% ] 1.61% | 1,067,409 | 86.5% |
[ 1.5% - 2.0% ] 1.84% | 693,979 | 87.1% |
[ 1.5% - 2.0% ] 2.00% | 1,555,936 | 86.4% |
[ 2.0% - 2.5% ] 2.18% | 304,093 | 88.7% |
[ 2.0% - 2.5% ] 2.36% | 750,791 | 86.6% |
[ 2.5% - 3.0% ] 2.56% | 529,146 | 86.3% |
[ 2.5% - 3.0% ] 2.77% | 321,337 | 86.3% |
[ 2.5% - 3.0% ] 2.94% | 250,754 | 87.9% |
[ 3.0% - 3.5% ] 3.14% | 366,617 | 85.8% |
[ 3.0% - 3.5% ] 3.33% | 430,339 | 83.7% |
[ 3.5% - 4.0% ] 3.55% | 655,448 | 86.8% |
[ 3.5% - 4.0% ] 3.72% | 594,852 | 79.3% |
[ 3.5% - 4.0% ] 3.99% | 96,877 | 82.0% |
[ 4.0% - 4.5% ] 4.15% | 434,328 | 88.6% |
[ 4.0% - 4.5% ] 4.30% | 352,083 | 82.1% |
[ 4.5% - 5.0% ] 4.52% | 196,179 | 86.5% |
[ 4.5% - 5.0% ] 4.68% | 133,624 | 84.3% |
[ 4.5% - 5.0% ] 4.82% | 240,211 | 88.2% |
[ 5.0% - 5.5% ] 5.05% | 119,732 | 84.6% |
[ 5.0% - 5.5% ] 5.22% | 50,797 | 92.1% |
[ 5.0% - 5.5% ] 5.36% | 95,081 | 83.6% |
[ 5.5% - 6.0% ] 5.65% | 146,976 | 85.8% |
[ 5.5% - 6.0% ] 5.81% | 15,184 | 94.6% |
[ 6.0% - 6.5% ] 6.02% | 240,424 | 92.9% |
[ 6.0% - 6.5% ] 6.26% | 22,202 | 92.4% |
[ 6.0% - 6.5% ] 6.41% | 79,823 | 91.4% |
[ 6.5% - 7.0% ] 6.65% | 27,228 | 94.0% |
[ 7.0% - 7.5% ] 7.19% | 56,589 | 94.3% |
[ 7.0% - 7.5% ] 7.27% | 25,283 | 87.4% |
[ 7.5% - 8.0% ] 7.72% | 22,475 | 87.2% |
[ 8.0% - 8.5% ] 8.00% | 19,895 | 91.7% |
[ 8.0% - 8.5% ] 8.02% | 212 | 87.1% |
[ 8.5% - 9.0% ] 8.53% | 49,068 | 82.7% |
[ 8.5% - 9.0% ] 8.73% | 51,142 | 87.3% |
[ 9.0% - 9.5% ] 9.01% | 222 | 80.3% |
[ 9.0% - 9.5% ] 9.16% | 14,557 | 97.2% |
[ 9.0% - 9.5% ] 9.43% | 2,419 | 74.0% |
[ 9.5% - 10.0% ] 9.70% | 78,478 | 79.4% |
[ 10.0% - 10.5% ] 10.01% | 23,734 | 96.5% |
[ 10.0% - 10.5% ] 10.44% | 22,540 | 97.2% |
[ 10.5% - 11.0% ] 10.53% | 66,299 | 81.8% |
[ 10.5% - 11.0% ] 10.78% | 57,150 | 77.7% |
[ 11.0% - 11.5% ] 11.46% | 20,034 | 92.5% |
[ 12.5% - 13.0% ] 12.86% | 70 | 91.4% |
[ 14.0% - 14.5% ] 14.06% | 68,029 | 96.1% |
[ 14.0% - 14.5% ] 14.26% | 54,464 | 81.4% |
[ 14.5% - 15.0% ] 14.53% | 57,878 | 87.3% |
[ 14.5% - 15.0% ] 14.96% | 548 | 98.9% |
[ 16.0% - 16.5% ] 16.13% | 11,809 | 95.1% |
[ 17.0% - 17.5% ] 17.23% | 383 | 90.4% |
[ 20.0% - 20.5% ] 20.40% | 5,843 | 95.6% |
[ 21.0% - 21.5% ] 21.29% | 155 | 87.7% |
[ 21.5% - 22.0% ] 21.95% | 41 | 100.0% |
[ 29.0% - 29.5% ] 29.04% | 1,873 | 85.2% |
[ 35.0% - 35.5% ] 35.06% | 64,751 | 85.7% |
[ 35.5% - 36.0% ] 35.53% | 74,891 | 86.8% |
[ 36.5% - 37.0% ] 36.55% | 249 | 97.1% |