Immigrants from Vietnam GED/Equivalency
COMPARE
Immigrants from Vietnam
Select to Compare
GED/Equivalency
Immigrants from Vietnam GED/Equivalency
83.2%
GED/EQUIVALENCY
0.3/ 100
METRIC RATING
259th/ 347
METRIC RANK
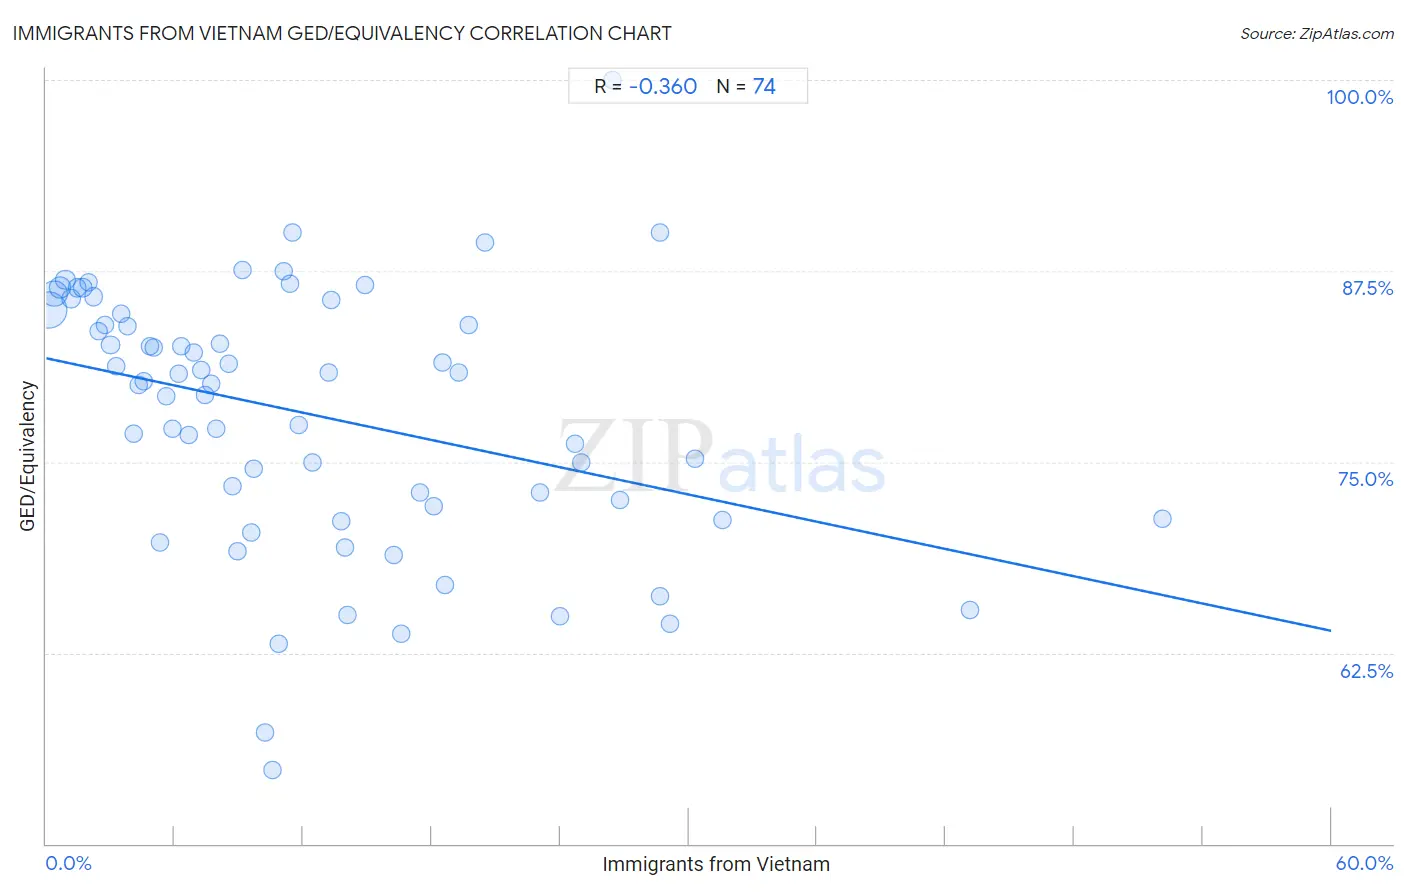
Immigrants from Vietnam GED/Equivalency Correlation Chart
The statistical analysis conducted on geographies consisting of 404,843,872 people shows a mild negative correlation between the proportion of Immigrants from Vietnam and percentage of population with at least ged/equivalency education in the United States with a correlation coefficient (R) of -0.360 and weighted average of 83.2%. On average, for every 1% (one percent) increase in Immigrants from Vietnam within a typical geography, there is a decrease of 0.30% in percentage of population with at least ged/equivalency education.
It is essential to understand that the correlation between the percentage of Immigrants from Vietnam and percentage of population with at least ged/equivalency education does not imply a direct cause-and-effect relationship. It remains uncertain whether the presence of Immigrants from Vietnam influences an upward or downward trend in the level of percentage of population with at least ged/equivalency education within an area, or if Immigrants from Vietnam simply ended up residing in those areas with higher or lower levels of percentage of population with at least ged/equivalency education due to other factors.
Demographics Similar to Immigrants from Vietnam by GED/Equivalency
In terms of ged/equivalency, the demographic groups most similar to Immigrants from Vietnam are Choctaw (83.1%, a difference of 0.030%), Inupiat (83.1%, a difference of 0.090%), Immigrants from Armenia (83.1%, a difference of 0.090%), Immigrants from Congo (83.1%, a difference of 0.10%), and Bangladeshi (83.1%, a difference of 0.11%).
| Demographics | Rating | Rank | GED/Equivalency |
| Bahamians | 0.8 /100 | #252 | Tragic 83.6% |
| Comanche | 0.7 /100 | #253 | Tragic 83.6% |
| Creek | 0.7 /100 | #254 | Tragic 83.6% |
| Colville | 0.5 /100 | #255 | Tragic 83.4% |
| Africans | 0.5 /100 | #256 | Tragic 83.4% |
| Jamaicans | 0.4 /100 | #257 | Tragic 83.3% |
| Malaysians | 0.4 /100 | #258 | Tragic 83.3% |
| Immigrants from Vietnam | 0.3 /100 | #259 | Tragic 83.2% |
| Choctaw | 0.3 /100 | #260 | Tragic 83.1% |
| Inupiat | 0.2 /100 | #261 | Tragic 83.1% |
| Immigrants from Armenia | 0.2 /100 | #262 | Tragic 83.1% |
| Immigrants from Congo | 0.2 /100 | #263 | Tragic 83.1% |
| Bangladeshis | 0.2 /100 | #264 | Tragic 83.1% |
| West Indians | 0.2 /100 | #265 | Tragic 83.1% |
| Kiowa | 0.2 /100 | #266 | Tragic 83.1% |
Immigrants from Vietnam GED/Equivalency Correlation Summary
| Measurement | Immigrants from Vietnam Data | GED/Equivalency Data |
| Minimum | 0.12% | 54.8% |
| Maximum | 52.1% | 100.0% |
| Range | 52.0% | 45.2% |
| Mean | 12.4% | 78.1% |
| Median | 9.6% | 80.2% |
| Interquartile 25% (IQ1) | 4.8% | 72.1% |
| Interquartile 75% (IQ3) | 18.1% | 84.7% |
| Interquartile Range (IQR) | 13.3% | 12.6% |
| Standard Deviation (Sample) | 10.3% | 8.5% |
| Standard Deviation (Population) | 10.2% | 8.5% |
Correlation Details
| Immigrants from Vietnam Percentile | Sample Size | GED/Equivalency |
[ 0.0% - 0.5% ] 0.12% | 204,351,999 | 85.0% |
[ 0.0% - 0.5% ] 0.37% | 85,290,635 | 86.0% |
[ 0.5% - 1.0% ] 0.64% | 40,736,389 | 86.4% |
[ 0.5% - 1.0% ] 0.90% | 18,451,439 | 86.9% |
[ 1.0% - 1.5% ] 1.18% | 16,104,405 | 85.7% |
[ 1.0% - 1.5% ] 1.43% | 7,164,885 | 86.4% |
[ 1.5% - 2.0% ] 1.72% | 9,069,486 | 86.4% |
[ 1.5% - 2.0% ] 1.97% | 4,016,753 | 86.7% |
[ 2.0% - 2.5% ] 2.20% | 3,073,613 | 85.8% |
[ 2.0% - 2.5% ] 2.46% | 2,400,258 | 83.5% |
[ 2.5% - 3.0% ] 2.73% | 1,512,339 | 84.0% |
[ 3.0% - 3.5% ] 3.00% | 1,430,150 | 82.7% |
[ 3.0% - 3.5% ] 3.28% | 1,215,280 | 81.3% |
[ 3.0% - 3.5% ] 3.50% | 950,369 | 84.7% |
[ 3.5% - 4.0% ] 3.77% | 665,249 | 83.9% |
[ 4.0% - 4.5% ] 4.07% | 1,151,932 | 76.9% |
[ 4.0% - 4.5% ] 4.31% | 524,011 | 80.0% |
[ 4.5% - 5.0% ] 4.54% | 313,400 | 80.3% |
[ 4.5% - 5.0% ] 4.83% | 396,139 | 82.6% |
[ 5.0% - 5.5% ] 5.03% | 247,215 | 82.5% |
[ 5.0% - 5.5% ] 5.32% | 479,249 | 69.7% |
[ 5.5% - 6.0% ] 5.62% | 325,873 | 79.3% |
[ 5.5% - 6.0% ] 5.90% | 297,884 | 77.1% |
[ 6.0% - 6.5% ] 6.18% | 337,142 | 80.8% |
[ 6.0% - 6.5% ] 6.29% | 42,330 | 82.6% |
[ 6.5% - 7.0% ] 6.64% | 242,629 | 76.8% |
[ 6.5% - 7.0% ] 6.89% | 93,660 | 82.2% |
[ 7.0% - 7.5% ] 7.21% | 185,946 | 81.0% |
[ 7.0% - 7.5% ] 7.39% | 167,688 | 79.4% |
[ 7.5% - 8.0% ] 7.71% | 114,943 | 80.1% |
[ 7.5% - 8.0% ] 7.96% | 275,428 | 77.2% |
[ 8.0% - 8.5% ] 8.13% | 1,107,074 | 82.7% |
[ 8.5% - 9.0% ] 8.51% | 71,794 | 81.4% |
[ 8.5% - 9.0% ] 8.70% | 805 | 73.4% |
[ 8.5% - 9.0% ] 8.95% | 167,797 | 69.1% |
[ 9.0% - 9.5% ] 9.19% | 158,485 | 87.5% |
[ 9.5% - 10.0% ] 9.55% | 183,803 | 70.4% |
[ 9.5% - 10.0% ] 9.70% | 84,862 | 74.6% |
[ 10.0% - 10.5% ] 10.21% | 61,939 | 57.3% |
[ 10.5% - 11.0% ] 10.54% | 44,528 | 54.8% |
[ 10.5% - 11.0% ] 10.83% | 120 | 63.1% |
[ 11.0% - 11.5% ] 11.11% | 17,842 | 87.5% |
[ 11.0% - 11.5% ] 11.35% | 20,230 | 86.7% |
[ 11.0% - 11.5% ] 11.48% | 61 | 90.0% |
[ 11.5% - 12.0% ] 11.78% | 74,703 | 77.5% |
[ 12.0% - 12.5% ] 12.45% | 40,001 | 75.0% |
[ 13.0% - 13.5% ] 13.22% | 1,241 | 80.8% |
[ 13.0% - 13.5% ] 13.29% | 40,981 | 85.6% |
[ 13.5% - 14.0% ] 13.77% | 31,102 | 71.1% |
[ 13.5% - 14.0% ] 13.95% | 38,271 | 69.4% |
[ 14.0% - 14.5% ] 14.08% | 61,688 | 65.0% |
[ 14.5% - 15.0% ] 14.88% | 142,257 | 86.6% |
[ 16.0% - 16.5% ] 16.20% | 790 | 68.9% |
[ 16.5% - 17.0% ] 16.59% | 53,476 | 63.7% |
[ 17.0% - 17.5% ] 17.45% | 7,786 | 73.0% |
[ 18.0% - 18.5% ] 18.11% | 113,587 | 72.1% |
[ 18.0% - 18.5% ] 18.48% | 92 | 81.5% |
[ 18.5% - 19.0% ] 18.62% | 127,330 | 66.9% |
[ 19.0% - 19.5% ] 19.25% | 45,688 | 80.8% |
[ 19.5% - 20.0% ] 19.75% | 1,691 | 84.0% |
[ 20.0% - 20.5% ] 20.49% | 893 | 89.4% |
[ 23.0% - 23.5% ] 23.07% | 171,637 | 73.0% |
[ 24.0% - 24.5% ] 24.01% | 2,916 | 64.9% |
[ 24.5% - 25.0% ] 24.66% | 36,657 | 76.2% |
[ 25.0% - 25.5% ] 25.00% | 4 | 75.0% |
[ 26.0% - 26.5% ] 26.46% | 427 | 100.0% |
[ 26.5% - 27.0% ] 26.81% | 34,188 | 72.5% |
[ 28.5% - 29.0% ] 28.67% | 593 | 90.0% |
[ 28.5% - 29.0% ] 28.68% | 47,549 | 66.2% |
[ 29.0% - 29.5% ] 29.13% | 16,072 | 64.4% |
[ 30.0% - 30.5% ] 30.26% | 181,268 | 75.2% |
[ 31.5% - 32.0% ] 31.56% | 22,622 | 71.2% |
[ 43.0% - 43.5% ] 43.10% | 116 | 65.3% |
[ 52.0% - 52.5% ] 52.13% | 188 | 71.3% |