Honduran GED/Equivalency
COMPARE
Honduran
Select to Compare
GED/Equivalency
Honduran GED/Equivalency
79.3%
GED/EQUIVALENCY
0.0/ 100
METRIC RATING
325th/ 347
METRIC RANK
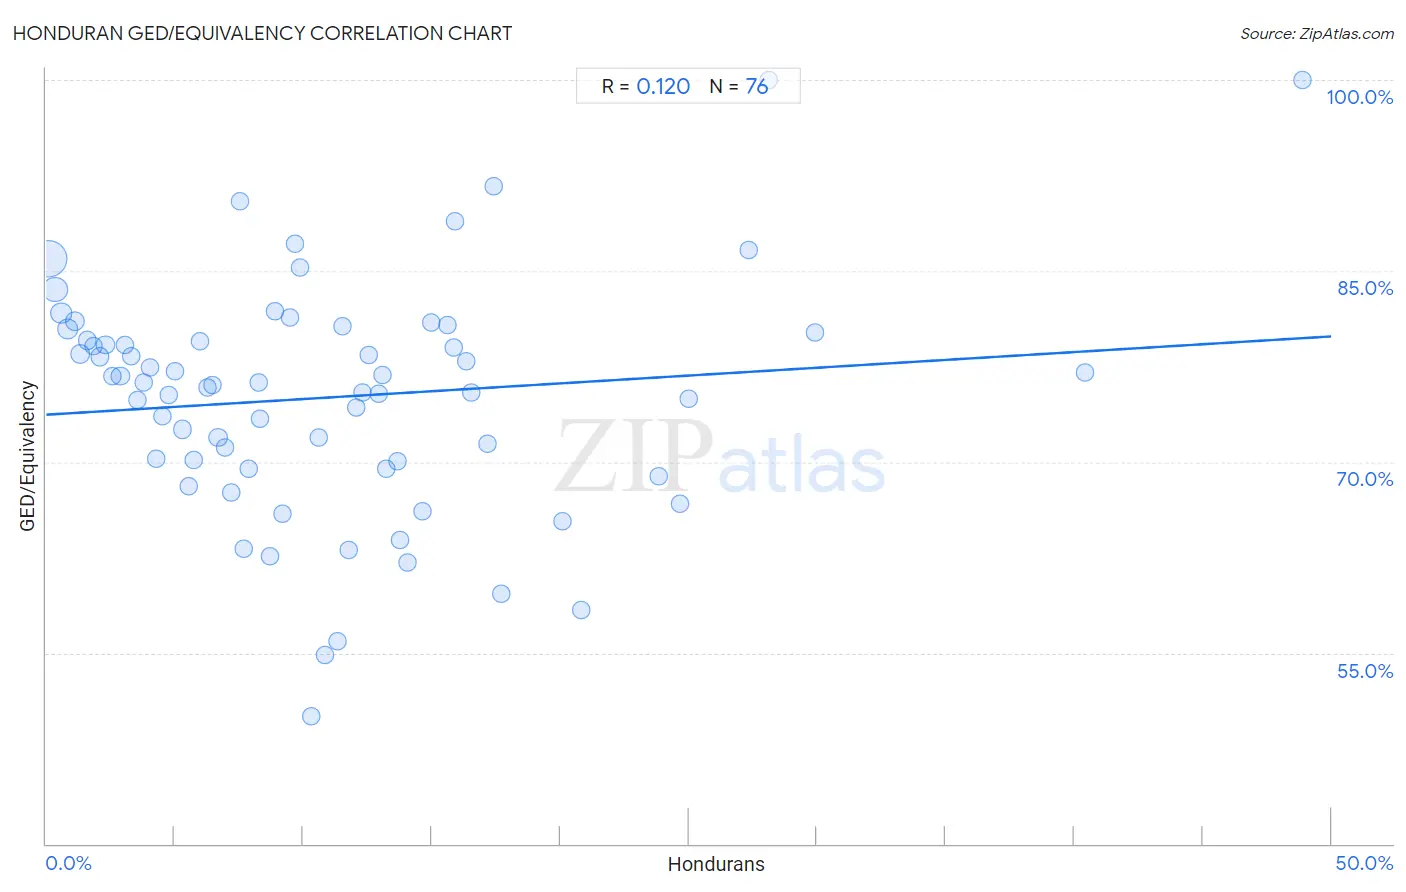
Honduran GED/Equivalency Correlation Chart
The statistical analysis conducted on geographies consisting of 357,858,578 people shows a poor positive correlation between the proportion of Hondurans and percentage of population with at least ged/equivalency education in the United States with a correlation coefficient (R) of 0.120 and weighted average of 79.3%. On average, for every 1% (one percent) increase in Hondurans within a typical geography, there is an increase of 0.12% in percentage of population with at least ged/equivalency education.
It is essential to understand that the correlation between the percentage of Hondurans and percentage of population with at least ged/equivalency education does not imply a direct cause-and-effect relationship. It remains uncertain whether the presence of Hondurans influences an upward or downward trend in the level of percentage of population with at least ged/equivalency education within an area, or if Hondurans simply ended up residing in those areas with higher or lower levels of percentage of population with at least ged/equivalency education due to other factors.
Demographics Similar to Hondurans by GED/Equivalency
In terms of ged/equivalency, the demographic groups most similar to Hondurans are Yuman (79.2%, a difference of 0.090%), Central American (79.2%, a difference of 0.11%), Mexican American Indian (79.4%, a difference of 0.12%), Hispanic or Latino (79.1%, a difference of 0.22%), and Dominican (79.1%, a difference of 0.27%).
| Demographics | Rating | Rank | GED/Equivalency |
| Yaqui | 0.0 /100 | #318 | Tragic 80.5% |
| Immigrants from Belize | 0.0 /100 | #319 | Tragic 80.5% |
| Immigrants from Cuba | 0.0 /100 | #320 | Tragic 80.2% |
| Yup'ik | 0.0 /100 | #321 | Tragic 80.0% |
| Lumbee | 0.0 /100 | #322 | Tragic 80.0% |
| Immigrants from Nicaragua | 0.0 /100 | #323 | Tragic 79.9% |
| Mexican American Indians | 0.0 /100 | #324 | Tragic 79.4% |
| Hondurans | 0.0 /100 | #325 | Tragic 79.3% |
| Yuman | 0.0 /100 | #326 | Tragic 79.2% |
| Central Americans | 0.0 /100 | #327 | Tragic 79.2% |
| Hispanics or Latinos | 0.0 /100 | #328 | Tragic 79.1% |
| Dominicans | 0.0 /100 | #329 | Tragic 79.1% |
| Immigrants from Cabo Verde | 0.0 /100 | #330 | Tragic 78.9% |
| Immigrants from Honduras | 0.0 /100 | #331 | Tragic 78.7% |
| Immigrants from the Azores | 0.0 /100 | #332 | Tragic 78.7% |
Honduran GED/Equivalency Correlation Summary
| Measurement | Honduran Data | GED/Equivalency Data |
| Minimum | 0.10% | 50.0% |
| Maximum | 48.9% | 100.0% |
| Range | 48.8% | 50.0% |
| Mean | 11.1% | 75.1% |
| Median | 9.4% | 76.2% |
| Interquartile 25% (IQ1) | 4.7% | 69.8% |
| Interquartile 75% (IQ3) | 14.8% | 79.8% |
| Interquartile Range (IQR) | 10.2% | 10.1% |
| Standard Deviation (Sample) | 9.0% | 9.2% |
| Standard Deviation (Population) | 8.9% | 9.1% |
Correlation Details
| Honduran Percentile | Sample Size | GED/Equivalency |
[ 0.0% - 0.5% ] 0.10% | 181,210,346 | 86.0% |
[ 0.0% - 0.5% ] 0.36% | 69,896,368 | 83.5% |
[ 0.5% - 1.0% ] 0.59% | 35,576,289 | 81.7% |
[ 0.5% - 1.0% ] 0.83% | 20,439,733 | 80.4% |
[ 1.0% - 1.5% ] 1.10% | 13,111,061 | 81.1% |
[ 1.0% - 1.5% ] 1.33% | 8,010,221 | 78.5% |
[ 1.5% - 2.0% ] 1.58% | 4,132,618 | 79.5% |
[ 1.5% - 2.0% ] 1.83% | 3,818,540 | 79.1% |
[ 2.0% - 2.5% ] 2.09% | 2,632,385 | 78.3% |
[ 2.0% - 2.5% ] 2.30% | 3,354,880 | 79.2% |
[ 2.5% - 3.0% ] 2.57% | 1,994,322 | 76.8% |
[ 2.5% - 3.0% ] 2.88% | 4,250,046 | 76.8% |
[ 3.0% - 3.5% ] 3.05% | 1,544,951 | 79.2% |
[ 3.0% - 3.5% ] 3.32% | 750,024 | 78.3% |
[ 3.5% - 4.0% ] 3.54% | 919,225 | 74.9% |
[ 3.5% - 4.0% ] 3.78% | 718,797 | 76.3% |
[ 4.0% - 4.5% ] 4.02% | 615,093 | 77.4% |
[ 4.0% - 4.5% ] 4.27% | 524,093 | 70.2% |
[ 4.5% - 5.0% ] 4.53% | 661,083 | 73.6% |
[ 4.5% - 5.0% ] 4.78% | 333,675 | 75.3% |
[ 5.0% - 5.5% ] 5.01% | 463,437 | 77.1% |
[ 5.0% - 5.5% ] 5.29% | 425,398 | 72.6% |
[ 5.5% - 6.0% ] 5.53% | 76,160 | 68.1% |
[ 5.5% - 6.0% ] 5.74% | 202,669 | 70.1% |
[ 5.5% - 6.0% ] 5.96% | 190,727 | 79.5% |
[ 6.0% - 6.5% ] 6.30% | 77,005 | 75.8% |
[ 6.0% - 6.5% ] 6.48% | 39,601 | 76.1% |
[ 6.5% - 7.0% ] 6.69% | 607,953 | 71.9% |
[ 6.5% - 7.0% ] 6.97% | 156,736 | 71.2% |
[ 7.0% - 7.5% ] 7.19% | 93,374 | 67.6% |
[ 7.5% - 8.0% ] 7.52% | 48,198 | 90.4% |
[ 7.5% - 8.0% ] 7.66% | 67,559 | 63.2% |
[ 7.5% - 8.0% ] 7.88% | 84,865 | 69.5% |
[ 8.0% - 8.5% ] 8.26% | 3,390 | 76.3% |
[ 8.0% - 8.5% ] 8.34% | 10,431 | 73.4% |
[ 8.5% - 9.0% ] 8.70% | 161 | 62.6% |
[ 8.5% - 9.0% ] 8.91% | 29,797 | 81.8% |
[ 9.0% - 9.5% ] 9.20% | 134,019 | 65.9% |
[ 9.5% - 10.0% ] 9.50% | 69,781 | 81.3% |
[ 9.5% - 10.0% ] 9.67% | 11,924 | 87.1% |
[ 9.5% - 10.0% ] 9.87% | 152 | 85.3% |
[ 10.0% - 10.5% ] 10.29% | 35,189 | 50.0% |
[ 10.5% - 11.0% ] 10.62% | 70,778 | 71.9% |
[ 10.5% - 11.0% ] 10.85% | 60,388 | 54.8% |
[ 11.0% - 11.5% ] 11.32% | 74,024 | 55.9% |
[ 11.5% - 12.0% ] 11.54% | 61,156 | 80.7% |
[ 11.5% - 12.0% ] 11.76% | 8,750 | 63.0% |
[ 12.0% - 12.5% ] 12.06% | 2,247 | 74.3% |
[ 12.0% - 12.5% ] 12.32% | 406 | 75.4% |
[ 12.5% - 13.0% ] 12.54% | 1,699 | 78.4% |
[ 12.5% - 13.0% ] 12.92% | 9,070 | 75.4% |
[ 13.0% - 13.5% ] 13.08% | 36,642 | 76.9% |
[ 13.0% - 13.5% ] 13.21% | 18,496 | 69.4% |
[ 13.5% - 14.0% ] 13.67% | 18,017 | 70.1% |
[ 13.5% - 14.0% ] 13.79% | 28,306 | 63.9% |
[ 14.0% - 14.5% ] 14.04% | 62,599 | 62.1% |
[ 14.5% - 15.0% ] 14.64% | 1,762 | 66.1% |
[ 15.0% - 15.5% ] 15.00% | 80 | 81.0% |
[ 15.5% - 16.0% ] 15.62% | 1,088 | 80.8% |
[ 15.5% - 16.0% ] 15.86% | 3,392 | 79.0% |
[ 15.5% - 16.0% ] 15.92% | 2,581 | 88.9% |
[ 16.0% - 16.5% ] 16.37% | 28,120 | 77.9% |
[ 16.5% - 17.0% ] 16.53% | 7,556 | 75.5% |
[ 17.0% - 17.5% ] 17.16% | 16,930 | 71.4% |
[ 17.0% - 17.5% ] 17.42% | 999 | 91.6% |
[ 17.5% - 18.0% ] 17.69% | 944 | 59.7% |
[ 20.0% - 20.5% ] 20.10% | 2,304 | 65.3% |
[ 20.5% - 21.0% ] 20.80% | 8,989 | 58.4% |
[ 23.5% - 24.0% ] 23.86% | 2,712 | 68.9% |
[ 24.5% - 25.0% ] 24.67% | 3,559 | 66.7% |
[ 25.0% - 25.5% ] 25.00% | 16 | 75.0% |
[ 27.0% - 27.5% ] 27.34% | 673 | 86.7% |
[ 28.0% - 28.5% ] 28.12% | 64 | 100.0% |
[ 29.5% - 30.0% ] 29.94% | 1,540 | 80.1% |
[ 40.0% - 40.5% ] 40.43% | 235 | 77.1% |
[ 48.5% - 49.0% ] 48.89% | 180 | 100.0% |