Apache GED/Equivalency

COMPARE

Apache
Race
Ancestry
AfghanAfricanAlaska NativeAlaskan AthabascanAlbanianAleutAlsatianAmericanApacheArabArapahoArgentineanArmenianAssyrian/Chaldean/SyriacAustralianAustrianBahamianBangladeshiBarbadianBasqueBelgianBelizeanBermudanBhutaneseBlackfeetBolivianBrazilianBritishBritish West IndianBulgarianBurmeseCajunCambodianCanadianCape VerdeanCarpatho RusynCelticCentral AmericanCentral American IndianCherokeeCheyenneChickasawChileanChineseChippewaChoctawColombianColvilleComancheCosta RicanCreeCreekCroatianCrowCubanCypriotCzechCzechoslovakianDanishDelawareDominicanDutchDutch West IndianEastern EuropeanEcuadorianEgyptianEnglishEstonianEthiopianEuropeanFijianFilipinoFinnishFrenchFrench American IndianFrench CanadianGermanGerman RussianGhanaianGreekGuamanian/ChamorroGuatemalanGuyaneseHaitianHmongHonduranHopiHoumaHungarianIcelanderIndian (Asian)IndonesianInupiatIranianIraqiIrishIroquoisIsraeliItalianJamaicanJapaneseJordanianKenyanKiowaKoreanLaotianLatvianLebaneseLiberianLithuanianLumbeeLuxembourgerMacedonianMalaysianMalteseMarshalleseMenomineeMexicanMexican American IndianMongolianMoroccanNative HawaiianNavajoNepaleseNew ZealanderNicaraguanNigerianNorthern EuropeanNorwegianOkinawanOsageOttawaPaiutePakistaniPalestinianPanamanianParaguayanPennsylvania GermanPeruvianPimaPolishPortuguesePotawatomiPuebloPuerto RicanPuget Sound SalishRomanianRussianSalvadoranSamoanScandinavianScotch-IrishScottishSeminoleSenegaleseSerbianShoshoneSierra LeoneanSiouxSlavicSlovakSloveneSomaliSouth AfricanSouth AmericanSouth American IndianSoviet UnionSpaniardSpanishSpanish AmericanSpanish American IndianSri LankanSubsaharan AfricanSudaneseSwedishSwissSyrianTaiwaneseThaiTlingit-HaidaTohono O'OdhamTonganTrinidadian and TobagonianTsimshianTurkishU.S. Virgin IslanderUgandanUkrainianUruguayanUteVenezuelanVietnameseWelshWest IndianYakamaYaquiYugoslavianYumanYup'ikZimbabwean
Immigration
NonimmigrantsImmigrantsAfghanistanAfricaAlbaniaArgentinaArmeniaAsiaAustraliaAustriaBahamasBangladeshBarbadosBelarusBelgiumBelizeBoliviaBosnia and HerzegovinaBrazilBulgariaBurma/MyanmarCabo VerdeCambodiaCameroonCanadaCaribbeanCentral AmericaChileChinaColombiaCongoCosta RicaCroatiaCubaCzechoslovakiaDenmarkDominicaDominican RepublicEastern AfricaEastern AsiaEastern EuropeEcuadorEgyptEl SalvadorEnglandEritreaEthiopiaEuropeFijiFranceGermanyGhanaGreeceGrenadaGuatemalaGuyanaHaitiHondurasHong KongHungaryIndiaIndonesiaIranIraqIrelandIsraelItalyJamaicaJapanJordanKazakhstanKenyaKoreaKuwaitLaosLatin AmericaLatviaLebanonLiberiaLithuaniaMalaysiaMexicoMicronesiaMiddle AfricaMoldovaMoroccoNepalNetherlandsNicaraguaNigeriaNorth AmericaNorth MacedoniaNorthern AfricaNorthern EuropeNorwayOceaniaPakistanPanamaPeruPhilippinesPolandPortugalRomaniaRussiaSaudi ArabiaScotlandSenegalSerbiaSierra LeoneSingaporeSomaliaSouth AfricaSouth AmericaSouth Central AsiaSouth Eastern AsiaSouthern EuropeSpainSri LankaSt. Vincent and the GrenadinesSudanSwedenSwitzerlandSyriaTaiwanThailandTrinidad and TobagoTurkeyUgandaUkraineUruguayUzbekistanVenezuelaVietnamWest IndiesWestern AfricaWestern AsiaWestern EuropeYemenZaireZimbabweAzores
Select to Compare
Race
Ancestry
AfghanAfricanAlaska NativeAlaskan AthabascanAlbanianAleutAlsatianAmericanArabArapahoArgentineanArmenianAssyrian/Chaldean/SyriacAustralianAustrianBahamianBangladeshiBarbadianBasqueBelgianBelizeanBermudanBhutaneseBlackfeetBolivianBrazilianBritishBritish West IndianBulgarianBurmeseCajunCambodianCanadianCape VerdeanCarpatho RusynCelticCentral AmericanCentral American IndianCherokeeCheyenneChickasawChileanChineseChippewaChoctawColombianColvilleComancheCosta RicanCreeCreekCroatianCrowCubanCypriotCzechCzechoslovakianDanishDelawareDominicanDutchDutch West IndianEastern EuropeanEcuadorianEgyptianEnglishEstonianEthiopianEuropeanFijianFilipinoFinnishFrenchFrench American IndianFrench CanadianGermanGerman RussianGhanaianGreekGuamanian/ChamorroGuatemalanGuyaneseHaitianHmongHonduranHopiHoumaHungarianIcelanderIndian (Asian)IndonesianInupiatIranianIraqiIrishIroquoisIsraeliItalianJamaicanJapaneseJordanianKenyanKiowaKoreanLaotianLatvianLebaneseLiberianLithuanianLumbeeLuxembourgerMacedonianMalaysianMalteseMarshalleseMenomineeMexicanMexican American IndianMongolianMoroccanNative HawaiianNavajoNepaleseNew ZealanderNicaraguanNigerianNorthern EuropeanNorwegianOkinawanOsageOttawaPaiutePakistaniPalestinianPanamanianParaguayanPennsylvania GermanPeruvianPimaPolishPortuguesePotawatomiPuebloPuerto RicanPuget Sound SalishRomanianRussianSalvadoranSamoanScandinavianScotch-IrishScottishSeminoleSenegaleseSerbianShoshoneSierra LeoneanSiouxSlavicSlovakSloveneSomaliSouth AfricanSouth AmericanSouth American IndianSoviet UnionSpaniardSpanishSpanish AmericanSpanish American IndianSri LankanSubsaharan AfricanSudaneseSwedishSwissSyrianTaiwaneseThaiTlingit-HaidaTohono O'OdhamTonganTrinidadian and TobagonianTsimshianTurkishU.S. Virgin IslanderUgandanUkrainianUruguayanUteVenezuelanVietnameseWelshWest IndianYakamaYaquiYugoslavianYumanYup'ikZimbabwean
Immigration
NonimmigrantsImmigrantsAfghanistanAfricaAlbaniaArgentinaArmeniaAsiaAustraliaAustriaBahamasBangladeshBarbadosBelarusBelgiumBelizeBoliviaBosnia and HerzegovinaBrazilBulgariaBurma/MyanmarCabo VerdeCambodiaCameroonCanadaCaribbeanCentral AmericaChileChinaColombiaCongoCosta RicaCroatiaCubaCzechoslovakiaDenmarkDominicaDominican RepublicEastern AfricaEastern AsiaEastern EuropeEcuadorEgyptEl SalvadorEnglandEritreaEthiopiaEuropeFijiFranceGermanyGhanaGreeceGrenadaGuatemalaGuyanaHaitiHondurasHong KongHungaryIndiaIndonesiaIranIraqIrelandIsraelItalyJamaicaJapanJordanKazakhstanKenyaKoreaKuwaitLaosLatin AmericaLatviaLebanonLiberiaLithuaniaMalaysiaMexicoMicronesiaMiddle AfricaMoldovaMoroccoNepalNetherlandsNicaraguaNigeriaNorth AmericaNorth MacedoniaNorthern AfricaNorthern EuropeNorwayOceaniaPakistanPanamaPeruPhilippinesPolandPortugalRomaniaRussiaSaudi ArabiaScotlandSenegalSerbiaSierra LeoneSingaporeSomaliaSouth AfricaSouth AmericaSouth Central AsiaSouth Eastern AsiaSouthern EuropeSpainSri LankaSt. Vincent and the GrenadinesSudanSwedenSwitzerlandSyriaTaiwanThailandTrinidad and TobagoTurkeyUgandaUkraineUruguayUzbekistanVenezuelaVietnamWest IndiesWestern AfricaWestern AsiaWestern EuropeYemenZaireZimbabweAzores
GED/Equivalency
Income
Poverty
Unemployment
Labor Participation
Family Structure
Vehicle Availability
Education Level
Disability

Apache GED/Equivalency
Tragic

80.7%
GED/EQUIVALENCY
0.0/ 100
METRIC RATING
315th/ 347
METRIC RANK

Apache GED/Equivalency Correlation Chart

The statistical analysis conducted on geographies consisting of 231,143,029 people shows a substantial negative correlation between the proportion of Apache and percentage of population with at least ged/equivalency education in the United States with a correlation coefficient (R) of -0.523 and weighted average of 80.7%. On average, for every 1% (one percent) increase in Apache within a typical geography, there is a decrease of 0.18% in percentage of population with at least ged/equivalency education.
Apache GED/Equivalency
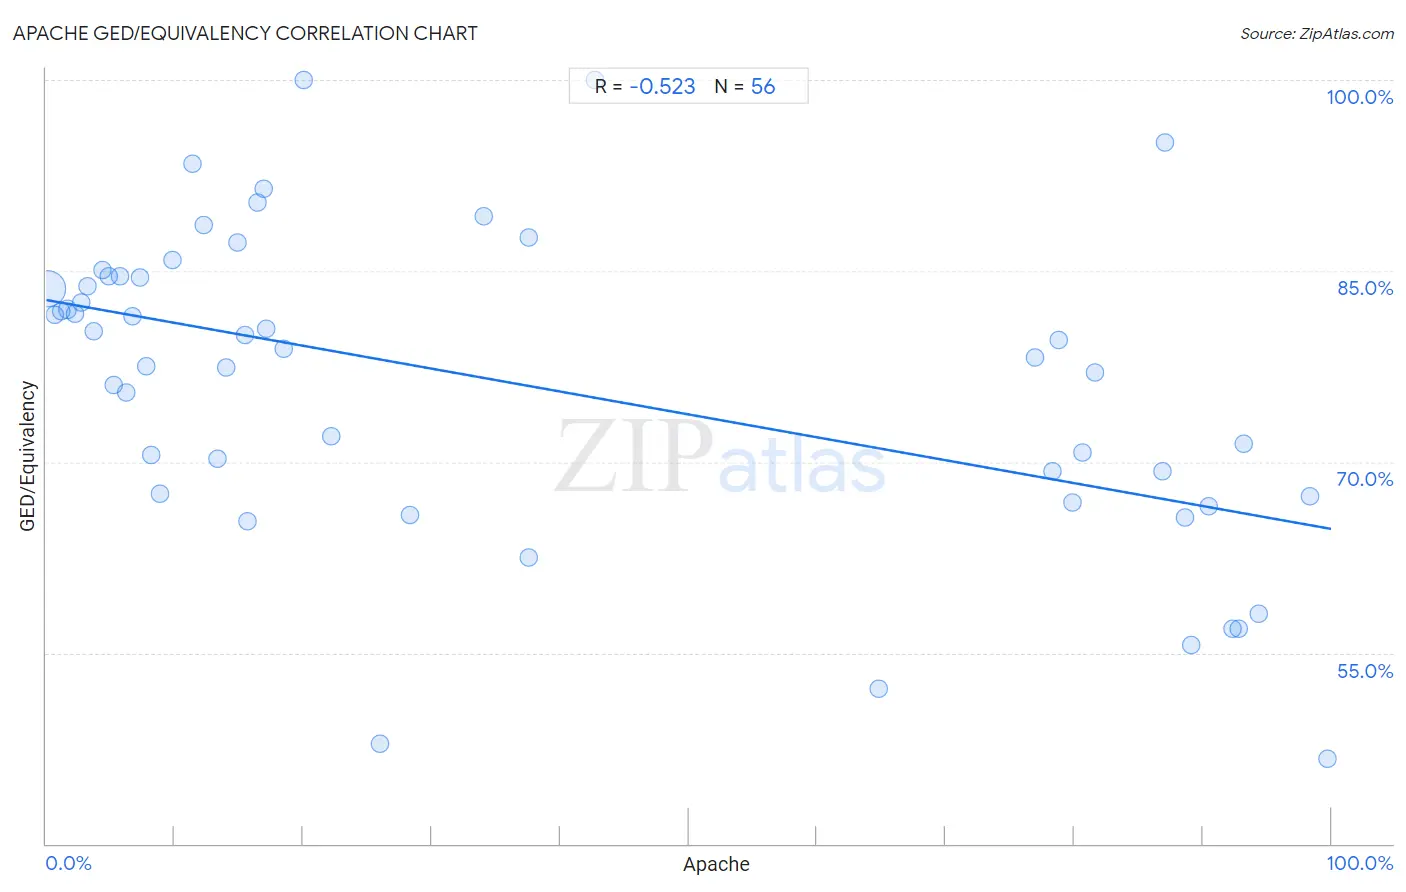
It is essential to understand that the correlation between the percentage of Apache and percentage of population with at least ged/equivalency education does not imply a direct cause-and-effect relationship. It remains uncertain whether the presence of Apache influences an upward or downward trend in the level of percentage of population with at least ged/equivalency education within an area, or if Apache simply ended up residing in those areas with higher or lower levels of percentage of population with at least ged/equivalency education due to other factors.

Demographics Similar to Apache by GED/Equivalency

In terms of ged/equivalency, the demographic groups most similar to Apache are Central American Indian (80.6%, a difference of 0.13%), Immigrants from Caribbean (80.5%, a difference of 0.24%), Belizean (80.9%, a difference of 0.25%), Yaqui (80.5%, a difference of 0.26%), and Immigrants from Belize (80.5%, a difference of 0.26%).
DemographicsRating | RankGED/Equivalency
Puerto Ricans
0.0
/100
|
#308
Tragic
81.1%
Immigrants from Ecuador
0.0
/100
|
#309
Tragic
81.0%
Immigrants from Guyana
0.0
/100
|
#310
Tragic
81.0%
Natives/Alaskans
0.0
/100
|
#311
Tragic
80.9%
Nicaraguans
0.0
/100
|
#312
Tragic
80.9%
Cape Verdeans
0.0
/100
|
#313
Tragic
80.9%
Belizeans
0.0
/100
|
#314
Tragic
80.9%
Apache
0.0
/100
|
#315
Tragic
80.7%
Central American Indians
0.0
/100
|
#316
Tragic
80.6%
Immigrants from Caribbean
0.0
/100
|
#317
Tragic
80.5%
Yaqui
0.0
/100
|
#318
Tragic
80.5%
Immigrants from Belize
0.0
/100
|
#319
Tragic
80.5%
Immigrants from Cuba
0.0
/100
|
#320
Tragic
80.2%
Yup'ik
0.0
/100
|
#321
Tragic
80.0%
Lumbee
0.0
/100
|
#322
Tragic
80.0%

Apache GED/Equivalency Correlation Summary

MeasurementApache DataGED/Equivalency Data
Minimum0.085%46.7%
Maximum99.7%100.0%
Range99.6%53.3%
Mean36.8%76.1%
Median17.1%78.5%
Interquartile 25% (IQ1)7.0%67.4%
Interquartile 75% (IQ3)79.3%84.5%
Interquartile Range (IQR)72.3%17.1%
Standard Deviation (Sample)36.0%12.4%
Standard Deviation (Population)35.6%12.2%

Correlation Details

Apache PercentileSample SizeGED/Equivalency
[
0.0%
-
0.5%
]
0.085%
224,601,39183.6%
[
0.5%
-
1.0%
]
0.67%
4,800,38481.6%
[
1.0%
-
1.5%
]
1.20%
909,98081.8%
[
1.5%
-
2.0%
]
1.68%
333,95582.0%
[
2.0%
-
2.5%
]
2.24%
179,08681.6%
[
2.5%
-
3.0%
]
2.69%
57,16182.5%
[
3.0%
-
3.5%
]
3.22%
44,30483.8%
[
3.5%
-
4.0%
]
3.73%
12,04280.3%
[
4.0%
-
4.5%
]
4.34%
42,77885.1%
[
4.5%
-
5.0%
]
4.83%
27,54084.6%
[
5.0%
-
5.5%
]
5.26%
33,65976.1%
[
5.5%
-
6.0%
]
5.72%
11,70284.6%
[
6.0%
-
6.5%
]
6.23%
3,28975.4%
[
6.5%
-
7.0%
]
6.75%
96381.4%
[
7.0%
-
7.5%
]
7.29%
2,48284.4%
[
7.5%
-
8.0%
]
7.79%
1,02777.5%
[
8.0%
-
8.5%
]
8.18%
48970.5%
[
8.5%
-
9.0%
]
8.84%
84867.5%
[
9.5%
-
10.0%
]
9.80%
8,28785.8%
[
11.0%
-
11.5%
]
11.35%
41493.4%
[
12.0%
-
12.5%
]
12.30%
6,31988.6%
[
13.0%
-
13.5%
]
13.33%
22570.2%
[
14.0%
-
14.5%
]
14.02%
27177.4%
[
14.5%
-
15.0%
]
14.90%
2,56387.3%
[
15.0%
-
15.5%
]
15.50%
34280.0%
[
15.5%
-
16.0%
]
15.69%
1,47965.4%
[
16.0%
-
16.5%
]
16.44%
1,92890.4%
[
16.5%
-
17.0%
]
16.97%
44291.4%
[
17.0%
-
17.5%
]
17.16%
16980.4%
[
18.0%
-
18.5%
]
18.45%
61878.9%
[
20.0%
-
20.5%
]
20.00%
10100.0%
[
22.0%
-
22.5%
]
22.22%
2772.0%
[
26.0%
-
26.5%
]
26.02%
24647.9%
[
28.0%
-
28.5%
]
28.26%
4665.8%
[
34.0%
-
34.5%
]
34.01%
14789.3%
[
37.0%
-
37.5%
]
37.50%
1662.5%
[
37.5%
-
38.0%
]
37.59%
13387.6%
[
42.5%
-
43.0%
]
42.73%
227100.0%
[
64.5%
-
65.0%
]
64.77%
45752.2%
[
76.5%
-
77.0%
]
76.94%
2,65078.2%
[
78.0%
-
78.5%
]
78.32%
7,06769.3%
[
78.5%
-
79.0%
]
78.81%
2,26179.5%
[
79.5%
-
80.0%
]
79.86%
4,40566.8%
[
80.5%
-
81.0%
]
80.68%
4,86070.8%
[
81.5%
-
82.0%
]
81.63%
98077.0%
[
86.5%
-
87.0%
]
86.87%
11,84069.3%
[
87.0%
-
87.5%
]
87.10%
83795.1%
[
88.5%
-
89.0%
]
88.66%
3,13065.7%
[
89.0%
-
89.5%
]
89.14%
1,62155.6%
[
90.0%
-
90.5%
]
90.48%
4,28466.5%
[
92.0%
-
92.5%
]
92.28%
3,11056.9%
[
92.5%
-
93.0%
]
92.84%
1,59256.9%
[
93.0%
-
93.5%
]
93.19%
2,17371.5%
[
94.0%
-
94.5%
]
94.31%
2,49758.1%
[
98.0%
-
98.5%
]
98.39%
1,55267.3%
[
99.5%
-
100.0%
]
99.72%
72446.7%