Immigrants from Dominica GED/Equivalency

COMPARE

Immigrants from Dominica
Race
Ancestry
AfghanAfricanAlaska NativeAlaskan AthabascanAlbanianAleutAlsatianAmericanApacheArabArapahoArgentineanArmenianAssyrian/Chaldean/SyriacAustralianAustrianBahamianBangladeshiBarbadianBasqueBelgianBelizeanBermudanBhutaneseBlackfeetBolivianBrazilianBritishBritish West IndianBulgarianBurmeseCajunCambodianCanadianCape VerdeanCarpatho RusynCelticCentral AmericanCentral American IndianCherokeeCheyenneChickasawChileanChineseChippewaChoctawColombianColvilleComancheCosta RicanCreeCreekCroatianCrowCubanCypriotCzechCzechoslovakianDanishDelawareDominicanDutchDutch West IndianEastern EuropeanEcuadorianEgyptianEnglishEstonianEthiopianEuropeanFijianFilipinoFinnishFrenchFrench American IndianFrench CanadianGermanGerman RussianGhanaianGreekGuamanian/ChamorroGuatemalanGuyaneseHaitianHmongHonduranHopiHoumaHungarianIcelanderIndian (Asian)IndonesianInupiatIranianIraqiIrishIroquoisIsraeliItalianJamaicanJapaneseJordanianKenyanKiowaKoreanLaotianLatvianLebaneseLiberianLithuanianLumbeeLuxembourgerMacedonianMalaysianMalteseMarshalleseMenomineeMexicanMexican American IndianMongolianMoroccanNative HawaiianNavajoNepaleseNew ZealanderNicaraguanNigerianNorthern EuropeanNorwegianOkinawanOsageOttawaPaiutePakistaniPalestinianPanamanianParaguayanPennsylvania GermanPeruvianPimaPolishPortuguesePotawatomiPuebloPuerto RicanPuget Sound SalishRomanianRussianSalvadoranSamoanScandinavianScotch-IrishScottishSeminoleSenegaleseSerbianShoshoneSierra LeoneanSiouxSlavicSlovakSloveneSomaliSouth AfricanSouth AmericanSouth American IndianSoviet UnionSpaniardSpanishSpanish AmericanSpanish American IndianSri LankanSubsaharan AfricanSudaneseSwedishSwissSyrianTaiwaneseThaiTlingit-HaidaTohono O'OdhamTonganTrinidadian and TobagonianTsimshianTurkishU.S. Virgin IslanderUgandanUkrainianUruguayanUteVenezuelanVietnameseWelshWest IndianYakamaYaquiYugoslavianYumanYup'ikZimbabwean
Immigration
NonimmigrantsImmigrantsAfghanistanAfricaAlbaniaArgentinaArmeniaAsiaAustraliaAustriaBahamasBangladeshBarbadosBelarusBelgiumBelizeBoliviaBosnia and HerzegovinaBrazilBulgariaBurma/MyanmarCabo VerdeCambodiaCameroonCanadaCaribbeanCentral AmericaChileChinaColombiaCongoCosta RicaCroatiaCubaCzechoslovakiaDenmarkDominicaDominican RepublicEastern AfricaEastern AsiaEastern EuropeEcuadorEgyptEl SalvadorEnglandEritreaEthiopiaEuropeFijiFranceGermanyGhanaGreeceGrenadaGuatemalaGuyanaHaitiHondurasHong KongHungaryIndiaIndonesiaIranIraqIrelandIsraelItalyJamaicaJapanJordanKazakhstanKenyaKoreaKuwaitLaosLatin AmericaLatviaLebanonLiberiaLithuaniaMalaysiaMexicoMicronesiaMiddle AfricaMoldovaMoroccoNepalNetherlandsNicaraguaNigeriaNorth AmericaNorth MacedoniaNorthern AfricaNorthern EuropeNorwayOceaniaPakistanPanamaPeruPhilippinesPolandPortugalRomaniaRussiaSaudi ArabiaScotlandSenegalSerbiaSierra LeoneSingaporeSomaliaSouth AfricaSouth AmericaSouth Central AsiaSouth Eastern AsiaSouthern EuropeSpainSri LankaSt. Vincent and the GrenadinesSudanSwedenSwitzerlandSyriaTaiwanThailandTrinidad and TobagoTurkeyUgandaUkraineUruguayUzbekistanVenezuelaVietnamWest IndiesWestern AfricaWestern AsiaWestern EuropeYemenZaireZimbabweAzores
Select to Compare
Race
Ancestry
AfghanAfricanAlaska NativeAlaskan AthabascanAlbanianAleutAlsatianAmericanApacheArabArapahoArgentineanArmenianAssyrian/Chaldean/SyriacAustralianAustrianBahamianBangladeshiBarbadianBasqueBelgianBelizeanBermudanBhutaneseBlackfeetBolivianBrazilianBritishBritish West IndianBulgarianBurmeseCajunCambodianCanadianCape VerdeanCarpatho RusynCelticCentral AmericanCentral American IndianCherokeeCheyenneChickasawChileanChineseChippewaChoctawColombianColvilleComancheCosta RicanCreeCreekCroatianCrowCubanCypriotCzechCzechoslovakianDanishDelawareDominicanDutchDutch West IndianEastern EuropeanEcuadorianEgyptianEnglishEstonianEthiopianEuropeanFijianFilipinoFinnishFrenchFrench American IndianFrench CanadianGermanGerman RussianGhanaianGreekGuamanian/ChamorroGuatemalanGuyaneseHaitianHmongHonduranHopiHoumaHungarianIcelanderIndian (Asian)IndonesianInupiatIranianIraqiIrishIroquoisIsraeliItalianJamaicanJapaneseJordanianKenyanKiowaKoreanLaotianLatvianLebaneseLiberianLithuanianLumbeeLuxembourgerMacedonianMalaysianMalteseMarshalleseMenomineeMexicanMexican American IndianMongolianMoroccanNative HawaiianNavajoNepaleseNew ZealanderNicaraguanNigerianNorthern EuropeanNorwegianOkinawanOsageOttawaPaiutePakistaniPalestinianPanamanianParaguayanPennsylvania GermanPeruvianPimaPolishPortuguesePotawatomiPuebloPuerto RicanPuget Sound SalishRomanianRussianSalvadoranSamoanScandinavianScotch-IrishScottishSeminoleSenegaleseSerbianShoshoneSierra LeoneanSiouxSlavicSlovakSloveneSomaliSouth AfricanSouth AmericanSouth American IndianSoviet UnionSpaniardSpanishSpanish AmericanSpanish American IndianSri LankanSubsaharan AfricanSudaneseSwedishSwissSyrianTaiwaneseThaiTlingit-HaidaTohono O'OdhamTonganTrinidadian and TobagonianTsimshianTurkishU.S. Virgin IslanderUgandanUkrainianUruguayanUteVenezuelanVietnameseWelshWest IndianYakamaYaquiYugoslavianYumanYup'ikZimbabwean
Immigration
NonimmigrantsImmigrantsAfghanistanAfricaAlbaniaArgentinaArmeniaAsiaAustraliaAustriaBahamasBangladeshBarbadosBelarusBelgiumBelizeBoliviaBosnia and HerzegovinaBrazilBulgariaBurma/MyanmarCabo VerdeCambodiaCameroonCanadaCaribbeanCentral AmericaChileChinaColombiaCongoCosta RicaCroatiaCubaCzechoslovakiaDenmarkDominican RepublicEastern AfricaEastern AsiaEastern EuropeEcuadorEgyptEl SalvadorEnglandEritreaEthiopiaEuropeFijiFranceGermanyGhanaGreeceGrenadaGuatemalaGuyanaHaitiHondurasHong KongHungaryIndiaIndonesiaIranIraqIrelandIsraelItalyJamaicaJapanJordanKazakhstanKenyaKoreaKuwaitLaosLatin AmericaLatviaLebanonLiberiaLithuaniaMalaysiaMexicoMicronesiaMiddle AfricaMoldovaMoroccoNepalNetherlandsNicaraguaNigeriaNorth AmericaNorth MacedoniaNorthern AfricaNorthern EuropeNorwayOceaniaPakistanPanamaPeruPhilippinesPolandPortugalRomaniaRussiaSaudi ArabiaScotlandSenegalSerbiaSierra LeoneSingaporeSomaliaSouth AfricaSouth AmericaSouth Central AsiaSouth Eastern AsiaSouthern EuropeSpainSri LankaSt. Vincent and the GrenadinesSudanSwedenSwitzerlandSyriaTaiwanThailandTrinidad and TobagoTurkeyUgandaUkraineUruguayUzbekistanVenezuelaVietnamWest IndiesWestern AfricaWestern AsiaWestern EuropeYemenZaireZimbabweAzores
GED/Equivalency
Income
Poverty
Unemployment
Labor Participation
Family Structure
Vehicle Availability
Education Level
Disability

Immigrants from Dominica GED/Equivalency
Tragic

81.1%
GED/EQUIVALENCY
0.0/ 100
METRIC RATING
307th/ 347
METRIC RANK

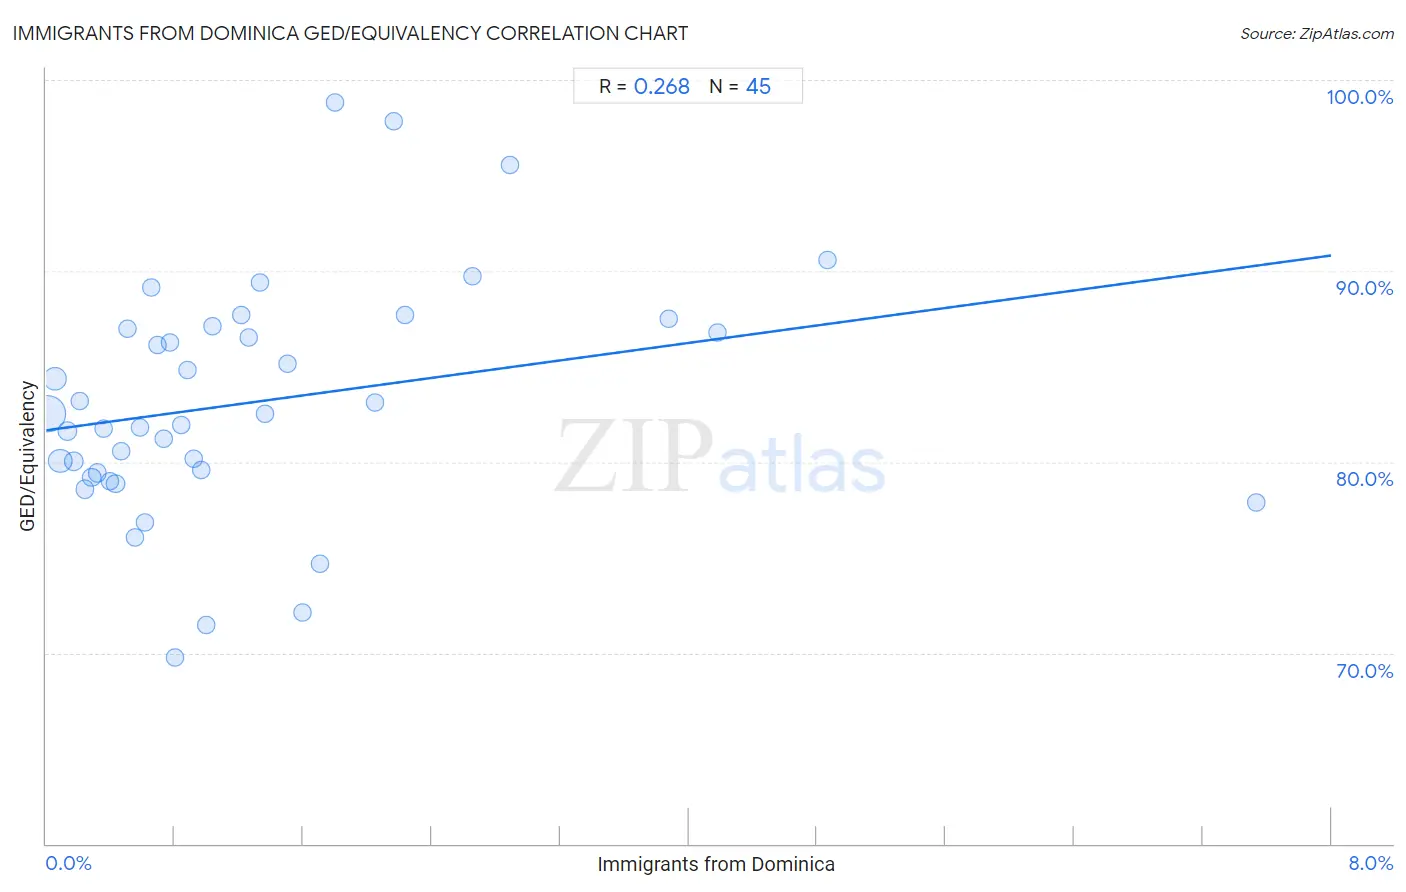
Immigrants from Dominica GED/Equivalency Correlation Chart

The statistical analysis conducted on geographies consisting of 83,794,115 people shows a weak positive correlation between the proportion of Immigrants from Dominica and percentage of population with at least ged/equivalency education in the United States with a correlation coefficient (R) of 0.268 and weighted average of 81.1%. On average, for every 1% (one percent) increase in Immigrants from Dominica within a typical geography, there is an increase of 1.1% in percentage of population with at least ged/equivalency education.
Immigrants from Dominica GED/Equivalency
It is essential to understand that the correlation between the percentage of Immigrants from Dominica and percentage of population with at least ged/equivalency education does not imply a direct cause-and-effect relationship. It remains uncertain whether the presence of Immigrants from Dominica influences an upward or downward trend in the level of percentage of population with at least ged/equivalency education within an area, or if Immigrants from Dominica simply ended up residing in those areas with higher or lower levels of percentage of population with at least ged/equivalency education due to other factors.

Demographics Similar to Immigrants from Dominica by GED/Equivalency

In terms of ged/equivalency, the demographic groups most similar to Immigrants from Dominica are Puerto Rican (81.1%, a difference of 0.10%), Guyanese (81.3%, a difference of 0.17%), Immigrants from Ecuador (81.0%, a difference of 0.18%), Immigrants from Grenada (81.3%, a difference of 0.19%), and Immigrants from Guyana (81.0%, a difference of 0.25%).
DemographicsRating | RankGED/Equivalency
Fijians
0.0
/100
|
#300
Tragic
81.6%
Dutch West Indians
0.0
/100
|
#301
Tragic
81.6%
Immigrants from Haiti
0.0
/100
|
#302
Tragic
81.6%
Immigrants from Portugal
0.0
/100
|
#303
Tragic
81.6%
Navajo
0.0
/100
|
#304
Tragic
81.5%
Immigrants from Grenada
0.0
/100
|
#305
Tragic
81.3%
Guyanese
0.0
/100
|
#306
Tragic
81.3%
Immigrants from Dominica
0.0
/100
|
#307
Tragic
81.1%
Puerto Ricans
0.0
/100
|
#308
Tragic
81.1%
Immigrants from Ecuador
0.0
/100
|
#309
Tragic
81.0%
Immigrants from Guyana
0.0
/100
|
#310
Tragic
81.0%
Natives/Alaskans
0.0
/100
|
#311
Tragic
80.9%
Nicaraguans
0.0
/100
|
#312
Tragic
80.9%
Cape Verdeans
0.0
/100
|
#313
Tragic
80.9%
Belizeans
0.0
/100
|
#314
Tragic
80.9%

Immigrants from Dominica GED/Equivalency Correlation Summary

MeasurementImmigrants from Dominica DataGED/Equivalency Data
Minimum0.011%69.7%
Maximum7.5%98.8%
Range7.5%29.1%
Mean1.3%83.1%
Median0.84%82.5%
Interquartile 25% (IQ1)0.41%79.3%
Interquartile 75% (IQ3)1.6%87.0%
Interquartile Range (IQR)1.2%7.8%
Standard Deviation (Sample)1.5%6.2%
Standard Deviation (Population)1.4%6.2%

Correlation Details

Immigrants from Dominica PercentileSample SizeGED/Equivalency
[
0.0%
-
0.5%
]
0.011%
44,804,90182.5%
[
0.0%
-
0.5%
]
0.055%
11,928,85184.3%
[
0.0%
-
0.5%
]
0.087%
13,741,81980.1%
[
0.0%
-
0.5%
]
0.13%
3,754,65881.6%
[
0.0%
-
0.5%
]
0.17%
2,776,23980.0%
[
0.0%
-
0.5%
]
0.21%
1,200,67183.2%
[
0.0%
-
0.5%
]
0.24%
689,77478.6%
[
0.0%
-
0.5%
]
0.28%
816,29879.2%
[
0.0%
-
0.5%
]
0.32%
891,24379.4%
[
0.0%
-
0.5%
]
0.36%
605,05981.7%
[
0.0%
-
0.5%
]
0.39%
322,64679.0%
[
0.0%
-
0.5%
]
0.43%
386,81478.8%
[
0.0%
-
0.5%
]
0.47%
314,71280.6%
[
0.5%
-
1.0%
]
0.50%
53,73587.0%
[
0.5%
-
1.0%
]
0.55%
297,09376.1%
[
0.5%
-
1.0%
]
0.58%
129,85081.8%
[
0.5%
-
1.0%
]
0.61%
267,87476.8%
[
0.5%
-
1.0%
]
0.65%
28,84689.2%
[
0.5%
-
1.0%
]
0.70%
57,17486.1%
[
0.5%
-
1.0%
]
0.73%
75,83581.2%
[
0.5%
-
1.0%
]
0.77%
149,34186.2%
[
0.5%
-
1.0%
]
0.80%
9,23969.7%
[
0.5%
-
1.0%
]
0.84%
22,69581.9%
[
0.5%
-
1.0%
]
0.88%
49,96384.8%
[
0.5%
-
1.0%
]
0.92%
169,32080.2%
[
0.5%
-
1.0%
]
0.97%
50,19379.6%
[
0.5%
-
1.0%
]
1.00%
12,65271.5%
[
1.0%
-
1.5%
]
1.03%
33,13987.1%
[
1.0%
-
1.5%
]
1.21%
2,97187.7%
[
1.0%
-
1.5%
]
1.26%
44,10186.5%
[
1.0%
-
1.5%
]
1.33%
4,65489.4%
[
1.0%
-
1.5%
]
1.37%
11,57182.5%
[
1.5%
-
2.0%
]
1.50%
30,22385.1%
[
1.5%
-
2.0%
]
1.60%
12,91572.1%
[
1.5%
-
2.0%
]
1.70%
11,50474.7%
[
1.5%
-
2.0%
]
1.79%
6,40898.8%
[
2.0%
-
2.5%
]
2.04%
7,73083.1%
[
2.0%
-
2.5%
]
2.17%
96997.8%
[
2.0%
-
2.5%
]
2.24%
1,43187.7%
[
2.5%
-
3.0%
]
2.65%
82989.7%
[
2.5%
-
3.0%
]
2.89%
79795.5%
[
3.5%
-
4.0%
]
3.88%
5,31587.5%
[
4.0%
-
4.5%
]
4.18%
52686.8%
[
4.5%
-
5.0%
]
4.87%
4,23390.6%
[
7.5%
-
8.0%
]
7.53%
7,30477.9%