Panamanian GED/Equivalency
COMPARE
Panamanian
Select to Compare
GED/Equivalency
Panamanian GED/Equivalency
85.0%
GED/EQUIVALENCY
15.3/ 100
METRIC RATING
203rd/ 347
METRIC RANK
Panamanian GED/Equivalency Correlation Chart
The statistical analysis conducted on geographies consisting of 281,248,812 people shows a weak positive correlation between the proportion of Panamanians and percentage of population with at least ged/equivalency education in the United States with a correlation coefficient (R) of 0.281 and weighted average of 85.0%. On average, for every 1% (one percent) increase in Panamanians within a typical geography, there is an increase of 0.26% in percentage of population with at least ged/equivalency education.
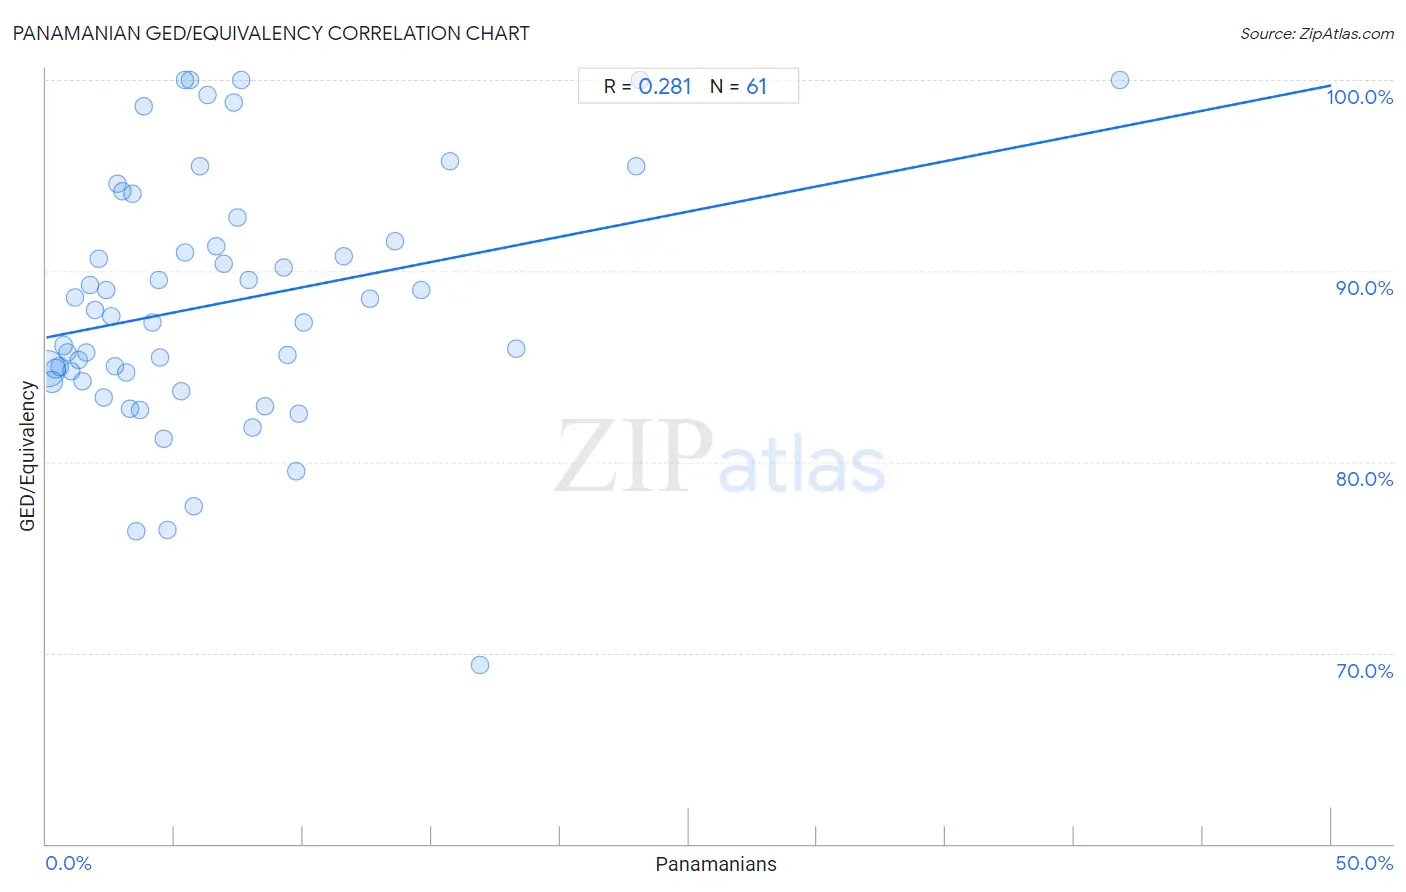
It is essential to understand that the correlation between the percentage of Panamanians and percentage of population with at least ged/equivalency education does not imply a direct cause-and-effect relationship. It remains uncertain whether the presence of Panamanians influences an upward or downward trend in the level of percentage of population with at least ged/equivalency education within an area, or if Panamanians simply ended up residing in those areas with higher or lower levels of percentage of population with at least ged/equivalency education due to other factors.
Demographics Similar to Panamanians by GED/Equivalency
In terms of ged/equivalency, the demographic groups most similar to Panamanians are Hawaiian (85.0%, a difference of 0.0%), Portuguese (85.0%, a difference of 0.020%), Cree (85.0%, a difference of 0.020%), Uruguayan (85.0%, a difference of 0.030%), and Liberian (85.0%, a difference of 0.030%).
| Demographics | Rating | Rank | GED/Equivalency |
| Tongans | 20.7 /100 | #196 | Fair 85.2% |
| Costa Ricans | 20.4 /100 | #197 | Fair 85.2% |
| Immigrants from Africa | 17.5 /100 | #198 | Poor 85.1% |
| Somalis | 16.4 /100 | #199 | Poor 85.0% |
| Uruguayans | 16.0 /100 | #200 | Poor 85.0% |
| Portuguese | 15.9 /100 | #201 | Poor 85.0% |
| Cree | 15.9 /100 | #202 | Poor 85.0% |
| Panamanians | 15.3 /100 | #203 | Poor 85.0% |
| Hawaiians | 15.2 /100 | #204 | Poor 85.0% |
| Liberians | 14.6 /100 | #205 | Poor 85.0% |
| Samoans | 13.7 /100 | #206 | Poor 84.9% |
| Hmong | 13.1 /100 | #207 | Poor 84.9% |
| Marshallese | 12.5 /100 | #208 | Poor 84.9% |
| Colombians | 12.3 /100 | #209 | Poor 84.9% |
| Immigrants from Cameroon | 12.1 /100 | #210 | Poor 84.9% |
Panamanian GED/Equivalency Correlation Summary
| Measurement | Panamanian Data | GED/Equivalency Data |
| Minimum | 0.062% | 69.4% |
| Maximum | 41.8% | 100.0% |
| Range | 41.7% | 30.6% |
| Mean | 6.8% | 88.3% |
| Median | 4.7% | 87.6% |
| Interquartile 25% (IQ1) | 2.3% | 84.4% |
| Interquartile 75% (IQ3) | 8.9% | 92.2% |
| Interquartile Range (IQR) | 6.6% | 7.7% |
| Standard Deviation (Sample) | 7.0% | 6.6% |
| Standard Deviation (Population) | 7.0% | 6.5% |
Correlation Details
| Panamanian Percentile | Sample Size | GED/Equivalency |
[ 0.0% - 0.5% ] 0.062% | 200,184,779 | 84.9% |
[ 0.0% - 0.5% ] 0.22% | 51,432,213 | 84.2% |
[ 0.0% - 0.5% ] 0.36% | 14,329,695 | 84.9% |
[ 0.5% - 1.0% ] 0.52% | 6,349,691 | 85.0% |
[ 0.5% - 1.0% ] 0.67% | 3,217,989 | 86.1% |
[ 0.5% - 1.0% ] 0.83% | 1,903,703 | 85.7% |
[ 0.5% - 1.0% ] 0.97% | 1,416,258 | 84.7% |
[ 1.0% - 1.5% ] 1.12% | 613,930 | 88.6% |
[ 1.0% - 1.5% ] 1.27% | 556,852 | 85.3% |
[ 1.0% - 1.5% ] 1.43% | 350,072 | 84.2% |
[ 1.5% - 2.0% ] 1.55% | 430,612 | 85.7% |
[ 1.5% - 2.0% ] 1.70% | 128,561 | 89.3% |
[ 1.5% - 2.0% ] 1.91% | 44,469 | 88.0% |
[ 2.0% - 2.5% ] 2.03% | 53,753 | 90.6% |
[ 2.0% - 2.5% ] 2.23% | 19,518 | 83.4% |
[ 2.0% - 2.5% ] 2.33% | 42,195 | 89.0% |
[ 2.5% - 3.0% ] 2.50% | 9,621 | 87.6% |
[ 2.5% - 3.0% ] 2.65% | 15,381 | 85.0% |
[ 2.5% - 3.0% ] 2.78% | 36,578 | 94.6% |
[ 2.5% - 3.0% ] 2.95% | 9,502 | 94.2% |
[ 3.0% - 3.5% ] 3.11% | 30,267 | 84.7% |
[ 3.0% - 3.5% ] 3.27% | 8,559 | 82.8% |
[ 3.0% - 3.5% ] 3.37% | 13,798 | 94.0% |
[ 3.5% - 4.0% ] 3.52% | 654 | 76.4% |
[ 3.5% - 4.0% ] 3.66% | 1,258 | 82.7% |
[ 3.5% - 4.0% ] 3.81% | 1,759 | 98.6% |
[ 4.0% - 4.5% ] 4.15% | 4,550 | 87.3% |
[ 4.0% - 4.5% ] 4.36% | 482 | 89.5% |
[ 4.0% - 4.5% ] 4.41% | 5,009 | 85.5% |
[ 4.5% - 5.0% ] 4.60% | 631 | 81.2% |
[ 4.5% - 5.0% ] 4.71% | 4,033 | 76.5% |
[ 5.0% - 5.5% ] 5.26% | 171 | 83.7% |
[ 5.0% - 5.5% ] 5.39% | 7,901 | 91.0% |
[ 5.0% - 5.5% ] 5.42% | 166 | 100.0% |
[ 5.5% - 6.0% ] 5.58% | 807 | 100.0% |
[ 5.5% - 6.0% ] 5.75% | 991 | 77.6% |
[ 5.5% - 6.0% ] 5.99% | 7,779 | 95.5% |
[ 6.0% - 6.5% ] 6.29% | 874 | 99.2% |
[ 6.5% - 7.0% ] 6.60% | 1,439 | 91.3% |
[ 6.5% - 7.0% ] 6.90% | 507 | 90.4% |
[ 7.0% - 7.5% ] 7.28% | 1,072 | 98.8% |
[ 7.0% - 7.5% ] 7.43% | 323 | 92.8% |
[ 7.5% - 8.0% ] 7.58% | 396 | 100.0% |
[ 7.5% - 8.0% ] 7.89% | 2,724 | 89.6% |
[ 8.0% - 8.5% ] 8.02% | 1,047 | 81.8% |
[ 8.0% - 8.5% ] 8.49% | 318 | 82.9% |
[ 9.0% - 9.5% ] 9.24% | 357 | 90.1% |
[ 9.0% - 9.5% ] 9.41% | 202 | 85.6% |
[ 9.5% - 10.0% ] 9.73% | 514 | 79.5% |
[ 9.5% - 10.0% ] 9.84% | 183 | 82.6% |
[ 10.0% - 10.5% ] 10.00% | 740 | 87.3% |
[ 11.5% - 12.0% ] 11.58% | 1,002 | 90.7% |
[ 12.5% - 13.0% ] 12.59% | 135 | 88.5% |
[ 13.5% - 14.0% ] 13.58% | 972 | 91.5% |
[ 14.5% - 15.0% ] 14.61% | 219 | 89.0% |
[ 15.5% - 16.0% ] 15.70% | 414 | 95.8% |
[ 16.5% - 17.0% ] 16.89% | 296 | 69.4% |
[ 18.0% - 18.5% ] 18.29% | 175 | 85.9% |
[ 22.5% - 23.0% ] 22.97% | 74 | 95.5% |
[ 23.0% - 23.5% ] 23.10% | 381 | 100.0% |
[ 41.5% - 42.0% ] 41.76% | 261 | 100.0% |