Colville GED/Equivalency
COMPARE
Colville
Select to Compare
GED/Equivalency
Colville GED/Equivalency
83.4%
GED/EQUIVALENCY
0.5/ 100
METRIC RATING
255th/ 347
METRIC RANK
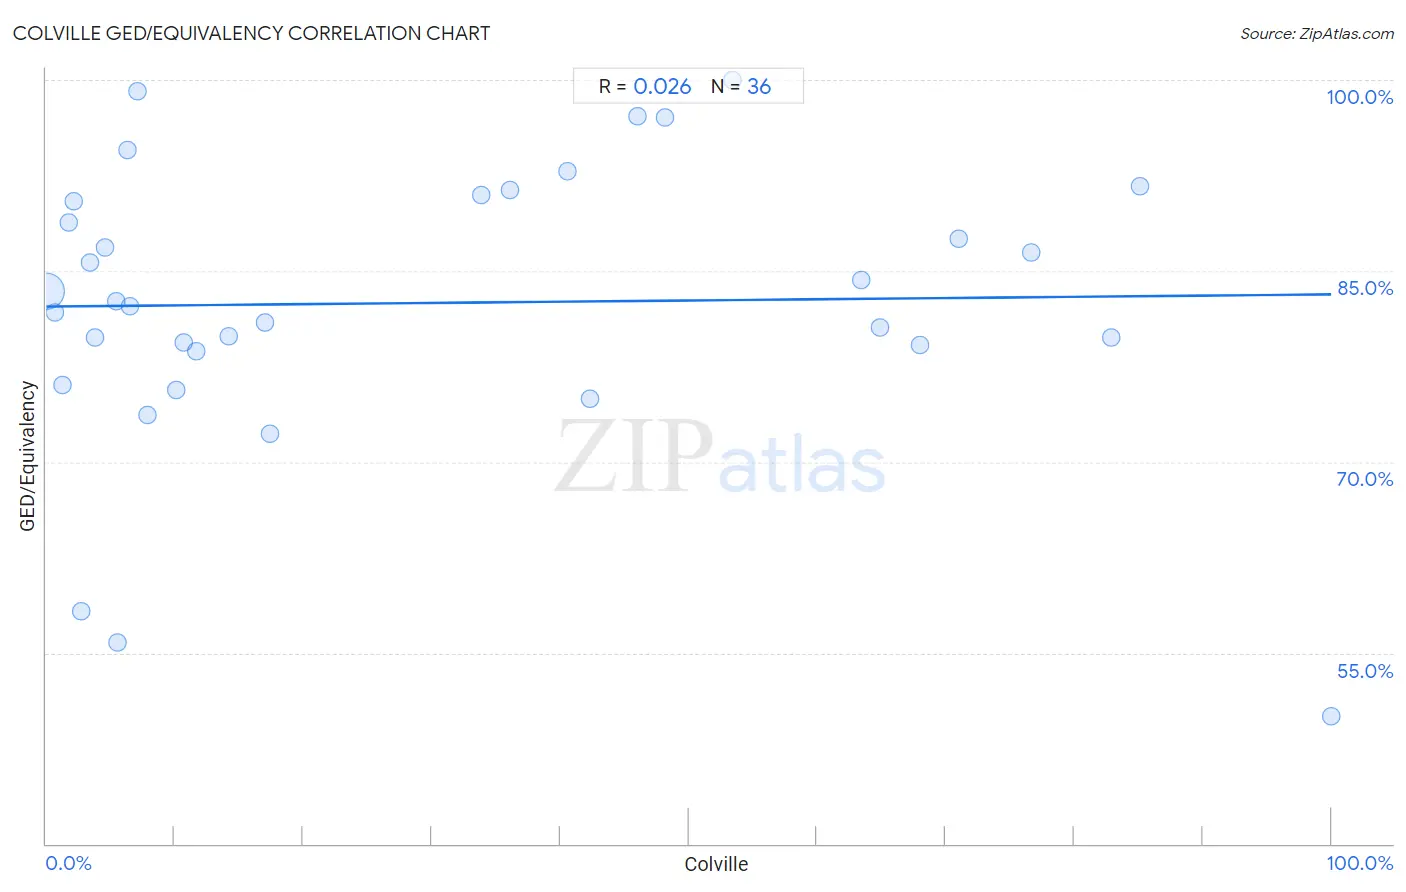
Colville GED/Equivalency Correlation Chart
The statistical analysis conducted on geographies consisting of 34,687,961 people shows no correlation between the proportion of Colville and percentage of population with at least ged/equivalency education in the United States with a correlation coefficient (R) of 0.026 and weighted average of 83.4%. On average, for every 1% (one percent) increase in Colville within a typical geography, there is an increase of 0.0096% in percentage of population with at least ged/equivalency education.
It is essential to understand that the correlation between the percentage of Colville and percentage of population with at least ged/equivalency education does not imply a direct cause-and-effect relationship. It remains uncertain whether the presence of Colville influences an upward or downward trend in the level of percentage of population with at least ged/equivalency education within an area, or if Colville simply ended up residing in those areas with higher or lower levels of percentage of population with at least ged/equivalency education due to other factors.
Demographics Similar to Colville by GED/Equivalency
In terms of ged/equivalency, the demographic groups most similar to Colville are African (83.4%, a difference of 0.010%), Jamaican (83.3%, a difference of 0.14%), Creek (83.6%, a difference of 0.17%), Malaysian (83.3%, a difference of 0.17%), and Comanche (83.6%, a difference of 0.20%).
| Demographics | Rating | Rank | GED/Equivalency |
| Blackfeet | 1.1 /100 | #248 | Tragic 83.8% |
| Crow | 1.1 /100 | #249 | Tragic 83.8% |
| Shoshone | 1.0 /100 | #250 | Tragic 83.7% |
| Spanish Americans | 0.8 /100 | #251 | Tragic 83.6% |
| Bahamians | 0.8 /100 | #252 | Tragic 83.6% |
| Comanche | 0.7 /100 | #253 | Tragic 83.6% |
| Creek | 0.7 /100 | #254 | Tragic 83.6% |
| Colville | 0.5 /100 | #255 | Tragic 83.4% |
| Africans | 0.5 /100 | #256 | Tragic 83.4% |
| Jamaicans | 0.4 /100 | #257 | Tragic 83.3% |
| Malaysians | 0.4 /100 | #258 | Tragic 83.3% |
| Immigrants from Vietnam | 0.3 /100 | #259 | Tragic 83.2% |
| Choctaw | 0.3 /100 | #260 | Tragic 83.1% |
| Inupiat | 0.2 /100 | #261 | Tragic 83.1% |
| Immigrants from Armenia | 0.2 /100 | #262 | Tragic 83.1% |
Colville GED/Equivalency Correlation Summary
| Measurement | Colville Data | GED/Equivalency Data |
| Minimum | 0.026% | 50.0% |
| Maximum | 100.0% | 100.0% |
| Range | 100.0% | 50.0% |
| Mean | 29.2% | 82.5% |
| Median | 12.9% | 82.4% |
| Interquartile 25% (IQ1) | 5.0% | 78.9% |
| Interquartile 75% (IQ3) | 50.8% | 90.7% |
| Interquartile Range (IQR) | 45.8% | 11.8% |
| Standard Deviation (Sample) | 30.1% | 11.2% |
| Standard Deviation (Population) | 29.7% | 11.1% |
Correlation Details
| Colville Percentile | Sample Size | GED/Equivalency |
[ 0.0% - 0.5% ] 0.026% | 34,437,796 | 83.4% |
[ 0.5% - 1.0% ] 0.65% | 131,244 | 81.8% |
[ 1.0% - 1.5% ] 1.28% | 35,844 | 76.0% |
[ 1.5% - 2.0% ] 1.70% | 13,619 | 88.8% |
[ 2.0% - 2.5% ] 2.11% | 17,953 | 90.4% |
[ 2.5% - 3.0% ] 2.74% | 5,867 | 58.3% |
[ 3.0% - 3.5% ] 3.37% | 5,404 | 85.6% |
[ 3.5% - 4.0% ] 3.83% | 4,957 | 79.8% |
[ 4.5% - 5.0% ] 4.55% | 5,587 | 86.8% |
[ 5.0% - 5.5% ] 5.44% | 643 | 82.6% |
[ 5.5% - 6.0% ] 5.53% | 561 | 55.8% |
[ 6.0% - 6.5% ] 6.32% | 918 | 94.5% |
[ 6.5% - 7.0% ] 6.56% | 5,456 | 82.2% |
[ 7.0% - 7.5% ] 7.09% | 127 | 99.1% |
[ 7.5% - 8.0% ] 7.92% | 1,098 | 73.7% |
[ 10.0% - 10.5% ] 10.15% | 1,034 | 75.7% |
[ 10.5% - 11.0% ] 10.66% | 122 | 79.4% |
[ 11.5% - 12.0% ] 11.68% | 865 | 78.7% |
[ 14.0% - 14.5% ] 14.22% | 9,218 | 79.9% |
[ 16.5% - 17.0% ] 16.99% | 1,377 | 80.9% |
[ 17.0% - 17.5% ] 17.45% | 424 | 72.2% |
[ 33.5% - 34.0% ] 33.81% | 1,538 | 91.0% |
[ 36.0% - 36.5% ] 36.06% | 1,334 | 91.3% |
[ 40.5% - 41.0% ] 40.54% | 74 | 92.9% |
[ 42.0% - 42.5% ] 42.28% | 395 | 74.9% |
[ 46.0% - 46.5% ] 46.01% | 276 | 97.1% |
[ 48.0% - 48.5% ] 48.15% | 270 | 97.1% |
[ 53.0% - 53.5% ] 53.39% | 236 | 100.0% |
[ 63.0% - 63.5% ] 63.38% | 568 | 84.3% |
[ 64.5% - 65.0% ] 64.91% | 1,103 | 80.6% |
[ 67.5% - 68.0% ] 67.97% | 256 | 79.2% |
[ 70.5% - 71.0% ] 70.97% | 155 | 87.5% |
[ 76.5% - 77.0% ] 76.66% | 977 | 86.4% |
[ 82.5% - 83.0% ] 82.84% | 338 | 79.7% |
[ 85.0% - 85.5% ] 85.11% | 309 | 91.6% |
[ 99.5% - 100.0% ] 100.00% | 18 | 50.0% |