Immigrants from Bangladesh GED/Equivalency
COMPARE
Immigrants from Bangladesh
Select to Compare
GED/Equivalency
Immigrants from Bangladesh GED/Equivalency
81.9%
GED/EQUIVALENCY
0.0/ 100
METRIC RATING
297th/ 347
METRIC RANK
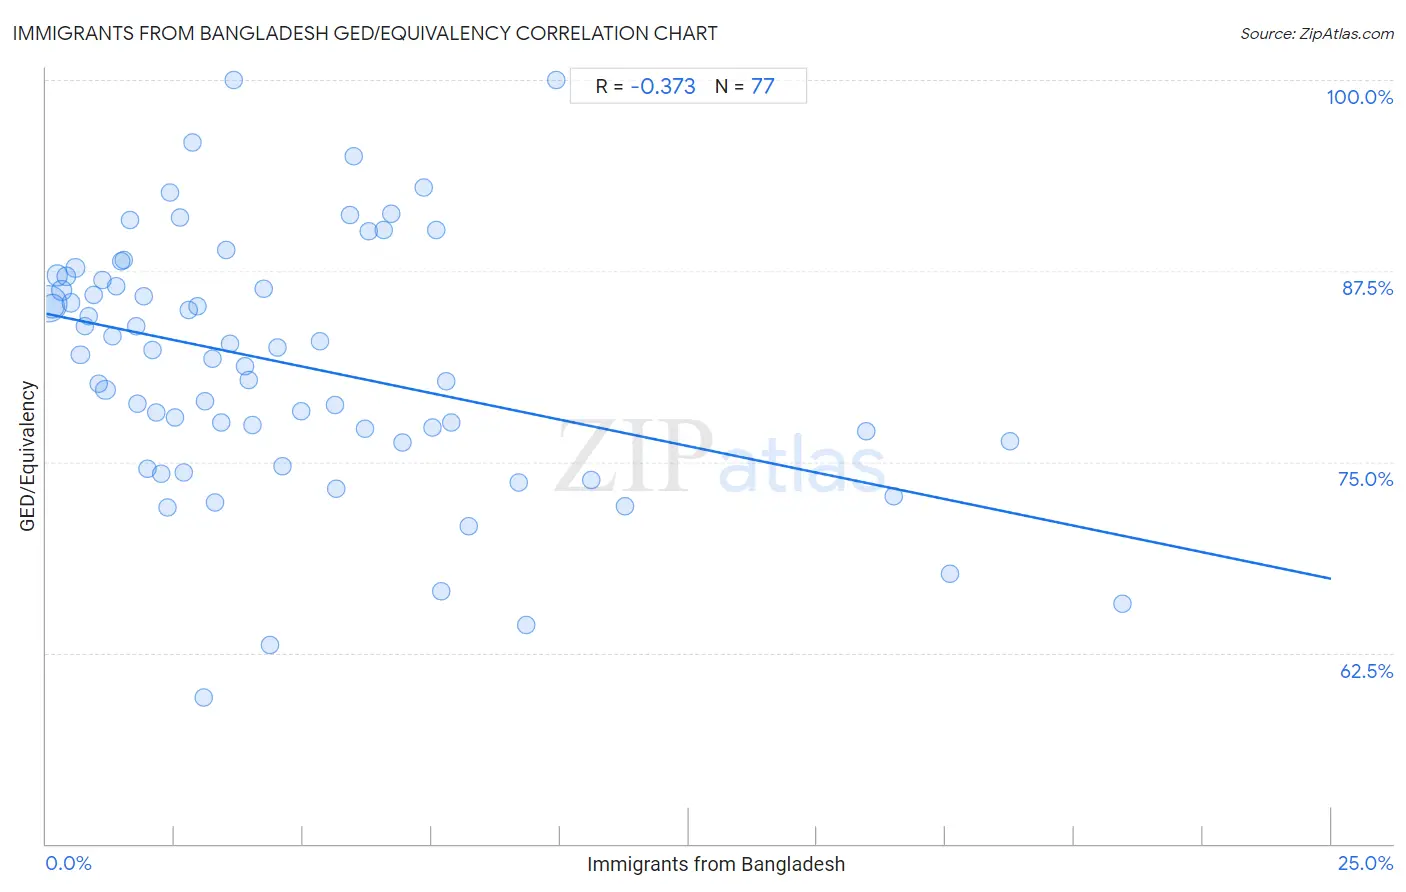
Immigrants from Bangladesh GED/Equivalency Correlation Chart
The statistical analysis conducted on geographies consisting of 203,682,679 people shows a mild negative correlation between the proportion of Immigrants from Bangladesh and percentage of population with at least ged/equivalency education in the United States with a correlation coefficient (R) of -0.373 and weighted average of 81.9%. On average, for every 1% (one percent) increase in Immigrants from Bangladesh within a typical geography, there is a decrease of 0.69% in percentage of population with at least ged/equivalency education.
It is essential to understand that the correlation between the percentage of Immigrants from Bangladesh and percentage of population with at least ged/equivalency education does not imply a direct cause-and-effect relationship. It remains uncertain whether the presence of Immigrants from Bangladesh influences an upward or downward trend in the level of percentage of population with at least ged/equivalency education within an area, or if Immigrants from Bangladesh simply ended up residing in those areas with higher or lower levels of percentage of population with at least ged/equivalency education due to other factors.
Demographics Similar to Immigrants from Bangladesh by GED/Equivalency
In terms of ged/equivalency, the demographic groups most similar to Immigrants from Bangladesh are Vietnamese (81.9%, a difference of 0.040%), Nepalese (81.9%, a difference of 0.070%), Ute (81.8%, a difference of 0.090%), Immigrants from St. Vincent and the Grenadines (82.0%, a difference of 0.13%), and Paiute (82.0%, a difference of 0.16%).
| Demographics | Rating | Rank | GED/Equivalency |
| Haitians | 0.0 /100 | #290 | Tragic 82.1% |
| Cubans | 0.0 /100 | #291 | Tragic 82.0% |
| Paiute | 0.0 /100 | #292 | Tragic 82.0% |
| British West Indians | 0.0 /100 | #293 | Tragic 82.0% |
| Immigrants from St. Vincent and the Grenadines | 0.0 /100 | #294 | Tragic 82.0% |
| Nepalese | 0.0 /100 | #295 | Tragic 81.9% |
| Vietnamese | 0.0 /100 | #296 | Tragic 81.9% |
| Immigrants from Bangladesh | 0.0 /100 | #297 | Tragic 81.9% |
| Ute | 0.0 /100 | #298 | Tragic 81.8% |
| Ecuadorians | 0.0 /100 | #299 | Tragic 81.7% |
| Fijians | 0.0 /100 | #300 | Tragic 81.6% |
| Dutch West Indians | 0.0 /100 | #301 | Tragic 81.6% |
| Immigrants from Haiti | 0.0 /100 | #302 | Tragic 81.6% |
| Immigrants from Portugal | 0.0 /100 | #303 | Tragic 81.6% |
| Navajo | 0.0 /100 | #304 | Tragic 81.5% |
Immigrants from Bangladesh GED/Equivalency Correlation Summary
| Measurement | Immigrants from Bangladesh Data | GED/Equivalency Data |
| Minimum | 0.039% | 59.6% |
| Maximum | 20.9% | 100.0% |
| Range | 20.9% | 40.4% |
| Mean | 4.8% | 81.4% |
| Median | 3.4% | 82.0% |
| Interquartile 25% (IQ1) | 1.7% | 76.3% |
| Interquartile 75% (IQ3) | 6.6% | 87.0% |
| Interquartile Range (IQR) | 5.0% | 10.7% |
| Standard Deviation (Sample) | 4.5% | 8.3% |
| Standard Deviation (Population) | 4.4% | 8.3% |
Correlation Details
| Immigrants from Bangladesh Percentile | Sample Size | GED/Equivalency |
[ 0.0% - 0.5% ] 0.039% | 108,356,206 | 85.4% |
[ 0.0% - 0.5% ] 0.13% | 36,628,864 | 85.2% |
[ 0.0% - 0.5% ] 0.21% | 17,111,458 | 87.2% |
[ 0.0% - 0.5% ] 0.30% | 9,286,310 | 86.2% |
[ 0.0% - 0.5% ] 0.39% | 6,285,094 | 87.2% |
[ 0.0% - 0.5% ] 0.48% | 3,691,069 | 85.4% |
[ 0.5% - 1.0% ] 0.57% | 2,409,748 | 87.7% |
[ 0.5% - 1.0% ] 0.66% | 2,803,672 | 82.0% |
[ 0.5% - 1.0% ] 0.74% | 1,370,068 | 83.9% |
[ 0.5% - 1.0% ] 0.83% | 891,307 | 84.5% |
[ 0.5% - 1.0% ] 0.92% | 800,993 | 85.9% |
[ 1.0% - 1.5% ] 1.02% | 657,713 | 80.1% |
[ 1.0% - 1.5% ] 1.09% | 330,383 | 86.9% |
[ 1.0% - 1.5% ] 1.16% | 8,980,699 | 79.7% |
[ 1.0% - 1.5% ] 1.28% | 285,824 | 83.3% |
[ 1.0% - 1.5% ] 1.37% | 170,889 | 86.5% |
[ 1.0% - 1.5% ] 1.46% | 230,746 | 88.1% |
[ 1.5% - 2.0% ] 1.52% | 118,471 | 88.2% |
[ 1.5% - 2.0% ] 1.63% | 98,687 | 90.8% |
[ 1.5% - 2.0% ] 1.74% | 211,865 | 83.9% |
[ 1.5% - 2.0% ] 1.78% | 382,155 | 78.8% |
[ 1.5% - 2.0% ] 1.89% | 69,610 | 85.9% |
[ 1.5% - 2.0% ] 1.97% | 214,782 | 74.6% |
[ 2.0% - 2.5% ] 2.06% | 78,110 | 82.3% |
[ 2.0% - 2.5% ] 2.13% | 42,368 | 78.3% |
[ 2.0% - 2.5% ] 2.24% | 46,309 | 74.2% |
[ 2.0% - 2.5% ] 2.36% | 60,080 | 72.0% |
[ 2.0% - 2.5% ] 2.41% | 28,884 | 92.6% |
[ 2.5% - 3.0% ] 2.51% | 153,852 | 77.9% |
[ 2.5% - 3.0% ] 2.61% | 31,106 | 91.0% |
[ 2.5% - 3.0% ] 2.68% | 164,756 | 74.3% |
[ 2.5% - 3.0% ] 2.78% | 9,966 | 84.9% |
[ 2.5% - 3.0% ] 2.84% | 5,285 | 95.9% |
[ 2.5% - 3.0% ] 2.94% | 23,797 | 85.2% |
[ 3.0% - 3.5% ] 3.06% | 9,973 | 59.6% |
[ 3.0% - 3.5% ] 3.10% | 46,794 | 79.0% |
[ 3.0% - 3.5% ] 3.24% | 145,098 | 81.8% |
[ 3.0% - 3.5% ] 3.27% | 94,815 | 72.3% |
[ 3.0% - 3.5% ] 3.40% | 90,548 | 77.6% |
[ 3.0% - 3.5% ] 3.50% | 3,688 | 88.9% |
[ 3.5% - 4.0% ] 3.57% | 50,650 | 82.7% |
[ 3.5% - 4.0% ] 3.64% | 467 | 100.0% |
[ 3.5% - 4.0% ] 3.86% | 2,279 | 81.3% |
[ 3.5% - 4.0% ] 3.93% | 25,606 | 80.3% |
[ 4.0% - 4.5% ] 4.00% | 67,001 | 77.4% |
[ 4.0% - 4.5% ] 4.23% | 40,198 | 86.4% |
[ 4.0% - 4.5% ] 4.36% | 67,847 | 63.0% |
[ 4.5% - 5.0% ] 4.51% | 29,308 | 82.5% |
[ 4.5% - 5.0% ] 4.60% | 12,129 | 74.7% |
[ 4.5% - 5.0% ] 4.96% | 126,907 | 78.3% |
[ 5.0% - 5.5% ] 5.32% | 73,318 | 82.9% |
[ 5.5% - 6.0% ] 5.61% | 97,668 | 78.8% |
[ 5.5% - 6.0% ] 5.64% | 127,805 | 73.2% |
[ 5.5% - 6.0% ] 5.90% | 3,490 | 91.1% |
[ 5.5% - 6.0% ] 5.99% | 317 | 95.0% |
[ 6.0% - 6.5% ] 6.21% | 5,923 | 77.2% |
[ 6.0% - 6.5% ] 6.28% | 26,939 | 90.1% |
[ 6.5% - 7.0% ] 6.56% | 366 | 90.2% |
[ 6.5% - 7.0% ] 6.72% | 1,504 | 91.3% |
[ 6.5% - 7.0% ] 6.93% | 30,063 | 76.2% |
[ 7.0% - 7.5% ] 7.35% | 1,102 | 92.9% |
[ 7.5% - 8.0% ] 7.51% | 28,327 | 77.2% |
[ 7.5% - 8.0% ] 7.60% | 4,146 | 90.2% |
[ 7.5% - 8.0% ] 7.70% | 52,160 | 66.5% |
[ 7.5% - 8.0% ] 7.77% | 29,921 | 80.3% |
[ 7.5% - 8.0% ] 7.88% | 77,230 | 77.6% |
[ 8.0% - 8.5% ] 8.22% | 59,961 | 70.8% |
[ 9.0% - 9.5% ] 9.20% | 31,200 | 73.7% |
[ 9.0% - 9.5% ] 9.33% | 847 | 64.3% |
[ 9.5% - 10.0% ] 9.91% | 938 | 100.0% |
[ 10.5% - 11.0% ] 10.61% | 3,006 | 73.8% |
[ 11.0% - 11.5% ] 11.26% | 27,794 | 72.1% |
[ 15.5% - 16.0% ] 15.95% | 17,472 | 77.0% |
[ 16.0% - 16.5% ] 16.49% | 1,425 | 72.8% |
[ 17.5% - 18.0% ] 17.59% | 27,842 | 67.7% |
[ 18.5% - 19.0% ] 18.74% | 64,268 | 76.4% |
[ 20.5% - 21.0% ] 20.93% | 43,213 | 65.7% |