Nigerian vs Immigrants from Russia Married-Couple Family Poverty

COMPARE

Nigerian
Race
Ancestry
AfghanAfricanAlaska NativeAlaskan AthabascanAlbanianAleutAlsatianAmericanApacheArabArapahoArgentineanArmenianAssyrian/Chaldean/SyriacAustralianAustrianBahamianBangladeshiBarbadianBasqueBelgianBelizeanBermudanBhutaneseBlackfeetBolivianBrazilianBritishBritish West IndianBulgarianBurmeseCajunCambodianCanadianCape VerdeanCarpatho RusynCelticCentral AmericanCentral American IndianCherokeeCheyenneChickasawChileanChineseChippewaChoctawColombianColvilleComancheCosta RicanCreeCreekCroatianCrowCubanCypriotCzechCzechoslovakianDanishDelawareDominicanDutchDutch West IndianEastern EuropeanEcuadorianEgyptianEnglishEstonianEthiopianEuropeanFijianFilipinoFinnishFrenchFrench American IndianFrench CanadianGermanGerman RussianGhanaianGreekGuamanian/ChamorroGuatemalanGuyaneseHaitianHmongHonduranHopiHoumaHungarianIcelanderIndian (Asian)IndonesianInupiatIranianIraqiIrishIroquoisIsraeliItalianJamaicanJapaneseJordanianKenyanKiowaKoreanLaotianLatvianLebaneseLiberianLithuanianLumbeeLuxembourgerMacedonianMalaysianMalteseMarshalleseMenomineeMexicanMexican American IndianMongolianMoroccanNative HawaiianNavajoNepaleseNew ZealanderNicaraguanNigerianNorthern EuropeanNorwegianOkinawanOsageOttawaPaiutePakistaniPalestinianPanamanianParaguayanPennsylvania GermanPeruvianPimaPolishPortuguesePotawatomiPuebloPuerto RicanPuget Sound SalishRomanianRussianSalvadoranSamoanScandinavianScotch-IrishScottishSeminoleSenegaleseSerbianShoshoneSierra LeoneanSiouxSlavicSlovakSloveneSomaliSouth AfricanSouth AmericanSouth American IndianSoviet UnionSpaniardSpanishSpanish AmericanSpanish American IndianSri LankanSubsaharan AfricanSudaneseSwedishSwissSyrianTaiwaneseThaiTlingit-HaidaTohono O'OdhamTonganTrinidadian and TobagonianTsimshianTurkishU.S. Virgin IslanderUgandanUkrainianUruguayanUteVenezuelanVietnameseWelshWest IndianYakamaYaquiYugoslavianYumanYup'ikZimbabwean
Immigration
NonimmigrantsImmigrantsAfghanistanAfricaAlbaniaArgentinaArmeniaAsiaAustraliaAustriaBahamasBangladeshBarbadosBelarusBelgiumBelizeBoliviaBosnia and HerzegovinaBrazilBulgariaBurma/MyanmarCabo VerdeCambodiaCameroonCanadaCaribbeanCentral AmericaChileChinaColombiaCongoCosta RicaCroatiaCubaCzechoslovakiaDenmarkDominicaDominican RepublicEastern AfricaEastern AsiaEastern EuropeEcuadorEgyptEl SalvadorEnglandEritreaEthiopiaEuropeFijiFranceGermanyGhanaGreeceGrenadaGuatemalaGuyanaHaitiHondurasHong KongHungaryIndiaIndonesiaIranIraqIrelandIsraelItalyJamaicaJapanJordanKazakhstanKenyaKoreaKuwaitLaosLatin AmericaLatviaLebanonLiberiaLithuaniaMalaysiaMexicoMicronesiaMiddle AfricaMoldovaMoroccoNepalNetherlandsNicaraguaNigeriaNorth AmericaNorth MacedoniaNorthern AfricaNorthern EuropeNorwayOceaniaPakistanPanamaPeruPhilippinesPolandPortugalRomaniaSaudi ArabiaScotlandSenegalSerbiaSierra LeoneSingaporeSomaliaSouth AfricaSouth AmericaSouth Central AsiaSouth Eastern AsiaSouthern EuropeSpainSri LankaSt. Vincent and the GrenadinesSudanSwedenSwitzerlandSyriaTaiwanThailandTrinidad and TobagoTurkeyUgandaUkraineUruguayUzbekistanVenezuelaVietnamWest IndiesWestern AfricaWestern AsiaWestern EuropeYemenZaireZimbabweAzores
Immigrants from Russia
Race
Ancestry
AfghanAfricanAlaska NativeAlaskan AthabascanAlbanianAleutAlsatianAmericanApacheArabArapahoArgentineanArmenianAssyrian/Chaldean/SyriacAustralianAustrianBahamianBangladeshiBarbadianBasqueBelgianBelizeanBermudanBhutaneseBlackfeetBolivianBrazilianBritishBritish West IndianBulgarianBurmeseCajunCambodianCanadianCape VerdeanCarpatho RusynCelticCentral AmericanCentral American IndianCherokeeCheyenneChickasawChileanChineseChippewaChoctawColombianColvilleComancheCosta RicanCreeCreekCroatianCrowCubanCypriotCzechCzechoslovakianDanishDelawareDominicanDutchDutch West IndianEastern EuropeanEcuadorianEgyptianEnglishEstonianEthiopianEuropeanFijianFilipinoFinnishFrenchFrench American IndianFrench CanadianGermanGerman RussianGhanaianGreekGuamanian/ChamorroGuatemalanGuyaneseHaitianHmongHonduranHopiHoumaHungarianIcelanderIndian (Asian)IndonesianInupiatIranianIraqiIrishIroquoisIsraeliItalianJamaicanJapaneseJordanianKenyanKiowaKoreanLaotianLatvianLebaneseLiberianLithuanianLumbeeLuxembourgerMacedonianMalaysianMalteseMarshalleseMenomineeMexicanMexican American IndianMongolianMoroccanNative HawaiianNavajoNepaleseNew ZealanderNicaraguanNorthern EuropeanNorwegianOkinawanOsageOttawaPaiutePakistaniPalestinianPanamanianParaguayanPennsylvania GermanPeruvianPimaPolishPortuguesePotawatomiPuebloPuerto RicanPuget Sound SalishRomanianRussianSalvadoranSamoanScandinavianScotch-IrishScottishSeminoleSenegaleseSerbianShoshoneSierra LeoneanSiouxSlavicSlovakSloveneSomaliSouth AfricanSouth AmericanSouth American IndianSoviet UnionSpaniardSpanishSpanish AmericanSpanish American IndianSri LankanSubsaharan AfricanSudaneseSwedishSwissSyrianTaiwaneseThaiTlingit-HaidaTohono O'OdhamTonganTrinidadian and TobagonianTsimshianTurkishU.S. Virgin IslanderUgandanUkrainianUruguayanUteVenezuelanVietnameseWelshWest IndianYakamaYaquiYugoslavianYumanYup'ikZimbabwean
Immigration
NonimmigrantsImmigrantsAfghanistanAfricaAlbaniaArgentinaArmeniaAsiaAustraliaAustriaBahamasBangladeshBarbadosBelarusBelgiumBelizeBoliviaBosnia and HerzegovinaBrazilBulgariaBurma/MyanmarCabo VerdeCambodiaCameroonCanadaCaribbeanCentral AmericaChileChinaColombiaCongoCosta RicaCroatiaCubaCzechoslovakiaDenmarkDominicaDominican RepublicEastern AfricaEastern AsiaEastern EuropeEcuadorEgyptEl SalvadorEnglandEritreaEthiopiaEuropeFijiFranceGermanyGhanaGreeceGrenadaGuatemalaGuyanaHaitiHondurasHong KongHungaryIndiaIndonesiaIranIraqIrelandIsraelItalyJamaicaJapanJordanKazakhstanKenyaKoreaKuwaitLaosLatin AmericaLatviaLebanonLiberiaLithuaniaMalaysiaMexicoMicronesiaMiddle AfricaMoldovaMoroccoNepalNetherlandsNicaraguaNigeriaNorth AmericaNorth MacedoniaNorthern AfricaNorthern EuropeNorwayOceaniaPakistanPanamaPeruPhilippinesPolandPortugalRomaniaRussiaSaudi ArabiaScotlandSenegalSerbiaSierra LeoneSingaporeSomaliaSouth AfricaSouth AmericaSouth Central AsiaSouth Eastern AsiaSouthern EuropeSpainSri LankaSt. Vincent and the GrenadinesSudanSwedenSwitzerlandSyriaTaiwanThailandTrinidad and TobagoTurkeyUgandaUkraineUruguayUzbekistanVenezuelaVietnamWest IndiesWestern AfricaWestern AsiaWestern EuropeYemenZaireZimbabweAzores
Married-Couple Family Poverty
Income
Poverty
Unemployment
Labor Participation
Family Structure
Vehicle Availability
Education Level
Disability

Married-Couple Family Poverty Comparison

Nigerians

Immigrants from Russia

Poor
Good
5.5%
MARRIED-COUPLE FAMILY POVERTY
14.3/ 100
METRIC RATING
211th/ 347
METRIC RANK
5.0%
MARRIED-COUPLE FAMILY POVERTY
78.7/ 100
METRIC RATING
148th/ 347
METRIC RANK

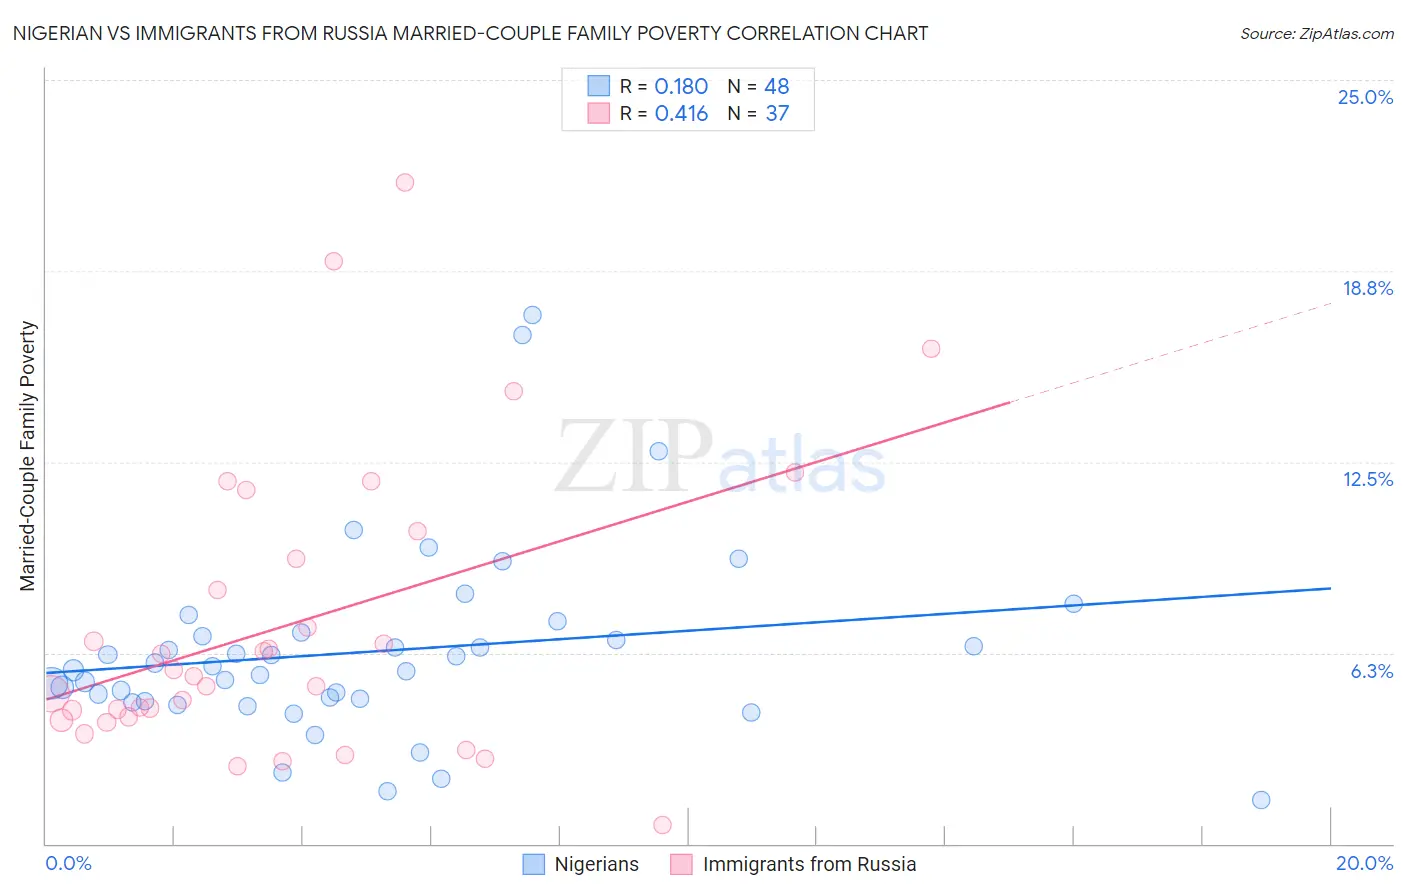
Nigerian vs Immigrants from Russia Married-Couple Family Poverty Correlation Chart

The statistical analysis conducted on geographies consisting of 330,785,707 people shows a poor positive correlation between the proportion of Nigerians and poverty level among married-couple families in the United States with a correlation coefficient (R) of 0.180 and weighted average of 5.5%. Similarly, the statistical analysis conducted on geographies consisting of 344,976,831 people shows a moderate positive correlation between the proportion of Immigrants from Russia and poverty level among married-couple families in the United States with a correlation coefficient (R) of 0.416 and weighted average of 5.0%, a difference of 9.3%.
Nigerian vs Immigrants from Russia Married-Couple Family Poverty

Married-Couple Family Poverty Correlation Summary

MeasurementNigerianImmigrants from Russia
Minimum1.4%0.60%
Maximum17.3%21.6%
Range15.9%21.0%
Mean6.3%7.2%
Median5.7%5.5%
Interquartile 25% (IQ1)4.7%4.1%
Interquartile 75% (IQ3)6.9%9.8%
Interquartile Range (IQR)2.1%5.7%
Standard Deviation (Sample)3.1%4.8%
Standard Deviation (Population)3.1%4.7%

Similar Demographics by Married-Couple Family Poverty

Demographics Similar to Nigerians by Married-Couple Family Poverty

In terms of married-couple family poverty, the demographic groups most similar to Nigerians are Immigrants from Micronesia (5.5%, a difference of 0.020%), Immigrants from Thailand (5.5%, a difference of 0.070%), Immigrants from Syria (5.5%, a difference of 0.23%), Immigrants from Liberia (5.5%, a difference of 0.25%), and Iroquois (5.5%, a difference of 0.29%).
DemographicsRating | RankMarried-Couple Family Poverty
Immigrants | Costa Rica
19.4
/100
|
#204
Poor
5.4%
Chippewa
18.9
/100
|
#205
Poor
5.4%
Osage
18.4
/100
|
#206
Poor
5.4%
Immigrants | Africa
17.6
/100
|
#207
Poor
5.5%
French American Indians
16.1
/100
|
#208
Poor
5.5%
Immigrants | Syria
15.4
/100
|
#209
Poor
5.5%
Immigrants | Micronesia
14.4
/100
|
#210
Poor
5.5%
Nigerians
14.3
/100
|
#211
Poor
5.5%
Immigrants | Thailand
14.0
/100
|
#212
Poor
5.5%
Immigrants | Liberia
13.3
/100
|
#213
Poor
5.5%
Iroquois
13.1
/100
|
#214
Poor
5.5%
Armenians
12.8
/100
|
#215
Poor
5.5%
Potawatomi
12.4
/100
|
#216
Poor
5.5%
Immigrants | Nigeria
11.3
/100
|
#217
Poor
5.5%
Afghans
11.2
/100
|
#218
Poor
5.5%

Demographics Similar to Immigrants from Russia by Married-Couple Family Poverty

In terms of married-couple family poverty, the demographic groups most similar to Immigrants from Russia are Syrian (5.0%, a difference of 0.0%), Immigrants from Oceania (5.0%, a difference of 0.030%), Brazilian (5.0%, a difference of 0.080%), Mongolian (5.0%, a difference of 0.20%), and Immigrants from Spain (5.0%, a difference of 0.21%).
DemographicsRating | RankMarried-Couple Family Poverty
Immigrants | Brazil
84.6
/100
|
#141
Excellent
5.0%
Immigrants | China
84.6
/100
|
#142
Excellent
5.0%
Immigrants | Egypt
83.4
/100
|
#143
Excellent
5.0%
Hmong
83.2
/100
|
#144
Excellent
5.0%
Immigrants | Spain
79.9
/100
|
#145
Good
5.0%
Mongolians
79.8
/100
|
#146
Good
5.0%
Syrians
78.7
/100
|
#147
Good
5.0%
Immigrants | Russia
78.7
/100
|
#148
Good
5.0%
Immigrants | Oceania
78.6
/100
|
#149
Good
5.0%
Brazilians
78.3
/100
|
#150
Good
5.0%
Immigrants | Cameroon
77.3
/100
|
#151
Good
5.0%
Albanians
77.2
/100
|
#152
Good
5.0%
Immigrants | Kuwait
76.3
/100
|
#153
Good
5.0%
Delaware
73.7
/100
|
#154
Good
5.1%
Immigrants | Ethiopia
72.4
/100
|
#155
Good
5.1%