Menominee vs Arapaho GED/Equivalency

COMPARE

Menominee
Race
Ancestry
AfghanAfricanAlaska NativeAlaskan AthabascanAlbanianAleutAlsatianAmericanApacheArabArgentineanArmenianAssyrian/Chaldean/SyriacAustralianAustrianBahamianBangladeshiBarbadianBasqueBelgianBelizeanBermudanBhutaneseBlackfeetBolivianBrazilianBritishBritish West IndianBulgarianBurmeseCajunCambodianCanadianCape VerdeanCarpatho RusynCelticCentral AmericanCentral American IndianCherokeeCheyenneChickasawChileanChineseChippewaChoctawColombianColvilleComancheCosta RicanCreeCreekCroatianCrowCubanCypriotCzechCzechoslovakianDanishDelawareDominicanDutchDutch West IndianEastern EuropeanEcuadorianEgyptianEnglishEstonianEthiopianEuropeanFijianFilipinoFinnishFrenchFrench American IndianFrench CanadianGermanGerman RussianGhanaianGreekGuamanian/ChamorroGuatemalanGuyaneseHaitianHmongHonduranHopiHoumaHungarianIcelanderIndian (Asian)IndonesianInupiatIranianIraqiIrishIroquoisIsraeliItalianJamaicanJapaneseJordanianKenyanKiowaKoreanLaotianLatvianLebaneseLiberianLithuanianLumbeeLuxembourgerMacedonianMalaysianMalteseMarshalleseMenomineeMexicanMexican American IndianMongolianMoroccanNative HawaiianNavajoNepaleseNew ZealanderNicaraguanNigerianNorthern EuropeanNorwegianOkinawanOsageOttawaPaiutePakistaniPalestinianPanamanianParaguayanPennsylvania GermanPeruvianPimaPolishPortuguesePotawatomiPuebloPuerto RicanPuget Sound SalishRomanianRussianSalvadoranSamoanScandinavianScotch-IrishScottishSeminoleSenegaleseSerbianShoshoneSierra LeoneanSiouxSlavicSlovakSloveneSomaliSouth AfricanSouth AmericanSouth American IndianSoviet UnionSpaniardSpanishSpanish AmericanSpanish American IndianSri LankanSubsaharan AfricanSudaneseSwedishSwissSyrianTaiwaneseThaiTlingit-HaidaTohono O'OdhamTonganTrinidadian and TobagonianTsimshianTurkishU.S. Virgin IslanderUgandanUkrainianUruguayanUteVenezuelanVietnameseWelshWest IndianYakamaYaquiYugoslavianYumanYup'ikZimbabwean
Immigration
NonimmigrantsImmigrantsAfghanistanAfricaAlbaniaArgentinaArmeniaAsiaAustraliaAustriaBahamasBangladeshBarbadosBelarusBelgiumBelizeBoliviaBosnia and HerzegovinaBrazilBulgariaBurma/MyanmarCabo VerdeCambodiaCameroonCanadaCaribbeanCentral AmericaChileChinaColombiaCongoCosta RicaCroatiaCubaCzechoslovakiaDenmarkDominicaDominican RepublicEastern AfricaEastern AsiaEastern EuropeEcuadorEgyptEl SalvadorEnglandEritreaEthiopiaEuropeFijiFranceGermanyGhanaGreeceGrenadaGuatemalaGuyanaHaitiHondurasHong KongHungaryIndiaIndonesiaIranIraqIrelandIsraelItalyJamaicaJapanJordanKazakhstanKenyaKoreaKuwaitLaosLatin AmericaLatviaLebanonLiberiaLithuaniaMalaysiaMexicoMicronesiaMiddle AfricaMoldovaMoroccoNepalNetherlandsNicaraguaNigeriaNorth AmericaNorth MacedoniaNorthern AfricaNorthern EuropeNorwayOceaniaPakistanPanamaPeruPhilippinesPolandPortugalRomaniaRussiaSaudi ArabiaScotlandSenegalSerbiaSierra LeoneSingaporeSomaliaSouth AfricaSouth AmericaSouth Central AsiaSouth Eastern AsiaSouthern EuropeSpainSri LankaSt. Vincent and the GrenadinesSudanSwedenSwitzerlandSyriaTaiwanThailandTrinidad and TobagoTurkeyUgandaUkraineUruguayUzbekistanVenezuelaVietnamWest IndiesWestern AfricaWestern AsiaWestern EuropeYemenZaireZimbabweAzores
Arapaho
Race
Ancestry
AfghanAfricanAlaska NativeAlaskan AthabascanAlbanianAleutAlsatianAmericanApacheArabArapahoArgentineanArmenianAssyrian/Chaldean/SyriacAustralianAustrianBahamianBangladeshiBarbadianBasqueBelgianBelizeanBermudanBhutaneseBlackfeetBolivianBrazilianBritishBritish West IndianBulgarianBurmeseCajunCambodianCanadianCape VerdeanCarpatho RusynCelticCentral AmericanCentral American IndianCherokeeCheyenneChickasawChileanChineseChippewaChoctawColombianColvilleComancheCosta RicanCreeCreekCroatianCrowCubanCypriotCzechCzechoslovakianDanishDelawareDominicanDutchDutch West IndianEastern EuropeanEcuadorianEgyptianEnglishEstonianEthiopianEuropeanFijianFilipinoFinnishFrenchFrench American IndianFrench CanadianGermanGerman RussianGhanaianGreekGuamanian/ChamorroGuatemalanGuyaneseHaitianHmongHonduranHopiHoumaHungarianIcelanderIndian (Asian)IndonesianInupiatIranianIraqiIrishIroquoisIsraeliItalianJamaicanJapaneseJordanianKenyanKiowaKoreanLaotianLatvianLebaneseLiberianLithuanianLumbeeLuxembourgerMacedonianMalaysianMalteseMarshalleseMexicanMexican American IndianMongolianMoroccanNative HawaiianNavajoNepaleseNew ZealanderNicaraguanNigerianNorthern EuropeanNorwegianOkinawanOsageOttawaPaiutePakistaniPalestinianPanamanianParaguayanPennsylvania GermanPeruvianPimaPolishPortuguesePotawatomiPuebloPuerto RicanPuget Sound SalishRomanianRussianSalvadoranSamoanScandinavianScotch-IrishScottishSeminoleSenegaleseSerbianShoshoneSierra LeoneanSiouxSlavicSlovakSloveneSomaliSouth AfricanSouth AmericanSouth American IndianSoviet UnionSpaniardSpanishSpanish AmericanSpanish American IndianSri LankanSubsaharan AfricanSudaneseSwedishSwissSyrianTaiwaneseThaiTlingit-HaidaTohono O'OdhamTonganTrinidadian and TobagonianTsimshianTurkishU.S. Virgin IslanderUgandanUkrainianUruguayanUteVenezuelanVietnameseWelshWest IndianYakamaYaquiYugoslavianYumanYup'ikZimbabwean
Immigration
NonimmigrantsImmigrantsAfghanistanAfricaAlbaniaArgentinaArmeniaAsiaAustraliaAustriaBahamasBangladeshBarbadosBelarusBelgiumBelizeBoliviaBosnia and HerzegovinaBrazilBulgariaBurma/MyanmarCabo VerdeCambodiaCameroonCanadaCaribbeanCentral AmericaChileChinaColombiaCongoCosta RicaCroatiaCubaCzechoslovakiaDenmarkDominicaDominican RepublicEastern AfricaEastern AsiaEastern EuropeEcuadorEgyptEl SalvadorEnglandEritreaEthiopiaEuropeFijiFranceGermanyGhanaGreeceGrenadaGuatemalaGuyanaHaitiHondurasHong KongHungaryIndiaIndonesiaIranIraqIrelandIsraelItalyJamaicaJapanJordanKazakhstanKenyaKoreaKuwaitLaosLatin AmericaLatviaLebanonLiberiaLithuaniaMalaysiaMexicoMicronesiaMiddle AfricaMoldovaMoroccoNepalNetherlandsNicaraguaNigeriaNorth AmericaNorth MacedoniaNorthern AfricaNorthern EuropeNorwayOceaniaPakistanPanamaPeruPhilippinesPolandPortugalRomaniaRussiaSaudi ArabiaScotlandSenegalSerbiaSierra LeoneSingaporeSomaliaSouth AfricaSouth AmericaSouth Central AsiaSouth Eastern AsiaSouthern EuropeSpainSri LankaSt. Vincent and the GrenadinesSudanSwedenSwitzerlandSyriaTaiwanThailandTrinidad and TobagoTurkeyUgandaUkraineUruguayUzbekistanVenezuelaVietnamWest IndiesWestern AfricaWestern AsiaWestern EuropeYemenZaireZimbabweAzores
GED/Equivalency
Income
Poverty
Unemployment
Labor Participation
Family Structure
Vehicle Availability
Education Level
Disability

GED/Equivalency Comparison

Menominee

Arapaho

Good
Tragic
86.3%
GED/EQUIVALENCY
79.3/ 100
METRIC RATING
149th/ 347
METRIC RANK
82.8%
GED/EQUIVALENCY
0.1/ 100
METRIC RATING
277th/ 347
METRIC RANK

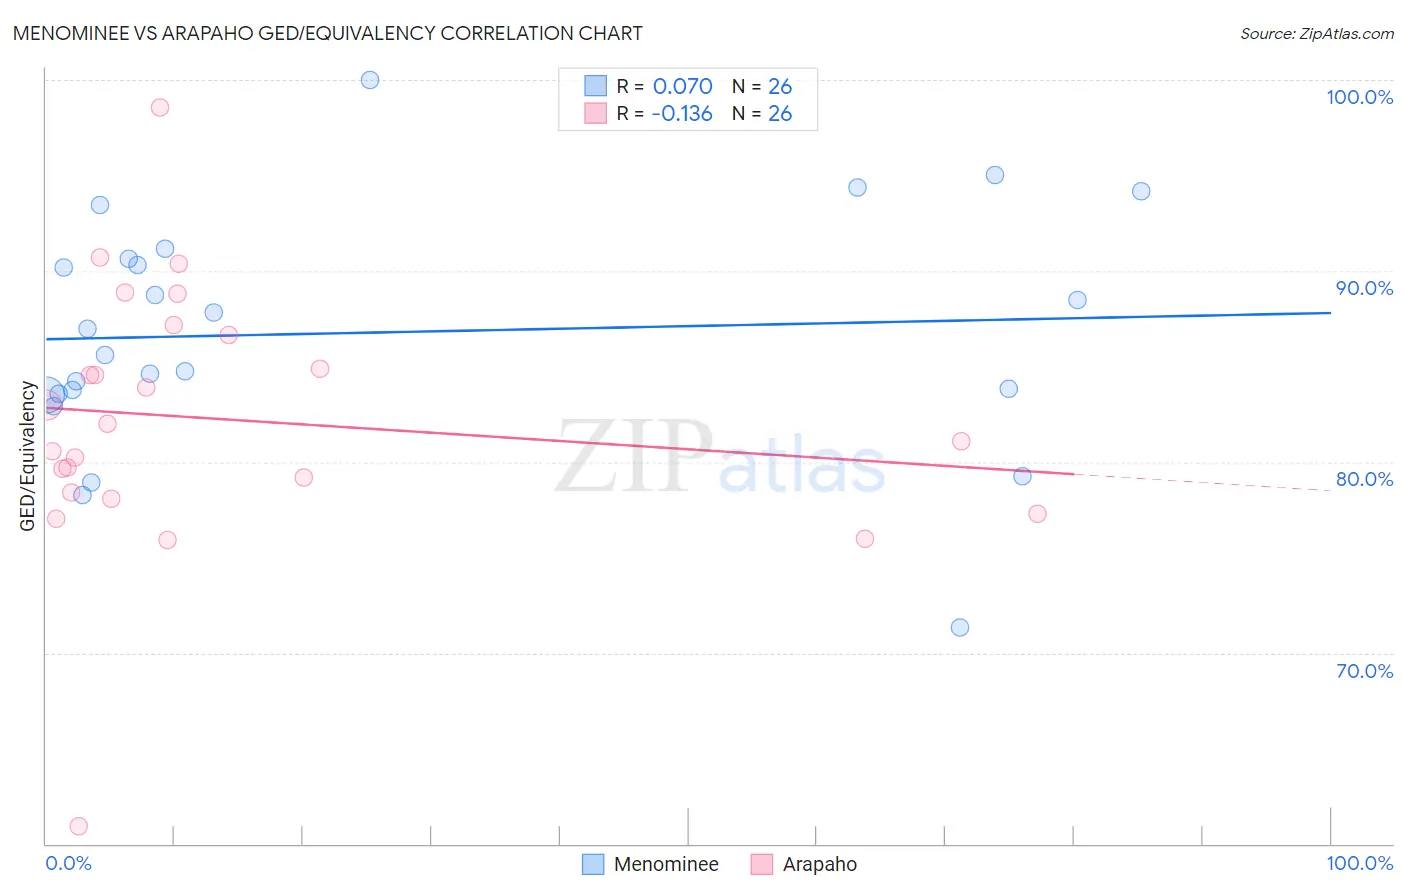
Menominee vs Arapaho GED/Equivalency Correlation Chart

The statistical analysis conducted on geographies consisting of 45,778,979 people shows a slight positive correlation between the proportion of Menominee and percentage of population with at least ged/equivalency education in the United States with a correlation coefficient (R) of 0.070 and weighted average of 86.3%. Similarly, the statistical analysis conducted on geographies consisting of 29,780,040 people shows a poor negative correlation between the proportion of Arapaho and percentage of population with at least ged/equivalency education in the United States with a correlation coefficient (R) of -0.136 and weighted average of 82.8%, a difference of 4.3%.
Menominee vs Arapaho GED/Equivalency

GED/Equivalency Correlation Summary

MeasurementMenomineeArapaho
Minimum71.3%60.9%
Maximum100.0%98.5%
Range28.7%37.6%
Mean86.8%82.2%
Median86.3%81.5%
Interquartile 25% (IQ1)83.6%78.4%
Interquartile 75% (IQ3)90.6%86.6%
Interquartile Range (IQR)7.1%8.2%
Standard Deviation (Sample)6.2%6.9%
Standard Deviation (Population)6.1%6.8%

Similar Demographics by GED/Equivalency

Demographics Similar to Menominee by GED/Equivalency

In terms of ged/equivalency, the demographic groups most similar to Menominee are Immigrants from Northern Africa (86.3%, a difference of 0.0%), Immigrants from Poland (86.3%, a difference of 0.0%), Basque (86.4%, a difference of 0.010%), Immigrants from Western Asia (86.3%, a difference of 0.010%), and Pakistani (86.4%, a difference of 0.040%).
DemographicsRating | RankGED/Equivalency
Immigrants | Indonesia
82.4
/100
|
#142
Excellent
86.4%
Immigrants | Pakistan
82.4
/100
|
#143
Excellent
86.4%
Bolivians
82.1
/100
|
#144
Excellent
86.4%
Pakistanis
80.4
/100
|
#145
Excellent
86.4%
Basques
79.5
/100
|
#146
Good
86.4%
Immigrants | Northern Africa
79.3
/100
|
#147
Good
86.3%
Immigrants | Poland
79.3
/100
|
#148
Good
86.3%
Menominee
79.3
/100
|
#149
Good
86.3%
Immigrants | Western Asia
78.8
/100
|
#150
Good
86.3%
Immigrants | Bosnia and Herzegovina
77.9
/100
|
#151
Good
86.3%
Brazilians
77.2
/100
|
#152
Good
86.3%
Kenyans
76.6
/100
|
#153
Good
86.3%
Armenians
76.4
/100
|
#154
Good
86.3%
Iraqis
75.2
/100
|
#155
Good
86.2%
Immigrants | Nepal
73.3
/100
|
#156
Good
86.2%

Demographics Similar to Arapaho by GED/Equivalency

In terms of ged/equivalency, the demographic groups most similar to Arapaho are Black/African American (82.8%, a difference of 0.020%), Immigrants from Laos (82.7%, a difference of 0.030%), Seminole (82.8%, a difference of 0.040%), Immigrants from Fiji (82.7%, a difference of 0.040%), and Cheyenne (82.7%, a difference of 0.050%).
DemographicsRating | RankGED/Equivalency
Immigrants | Jamaica
0.2
/100
|
#270
Tragic
82.9%
U.S. Virgin Islanders
0.2
/100
|
#271
Tragic
82.9%
Barbadians
0.1
/100
|
#272
Tragic
82.9%
Pennsylvania Germans
0.1
/100
|
#273
Tragic
82.9%
Immigrants | Trinidad and Tobago
0.1
/100
|
#274
Tragic
82.8%
Seminole
0.1
/100
|
#275
Tragic
82.8%
Blacks/African Americans
0.1
/100
|
#276
Tragic
82.8%
Arapaho
0.1
/100
|
#277
Tragic
82.8%
Immigrants | Laos
0.1
/100
|
#278
Tragic
82.7%
Immigrants | Fiji
0.1
/100
|
#279
Tragic
82.7%
Cheyenne
0.1
/100
|
#280
Tragic
82.7%
Sioux
0.1
/100
|
#281
Tragic
82.6%
Immigrants | Immigrants
0.1
/100
|
#282
Tragic
82.6%
Indonesians
0.1
/100
|
#283
Tragic
82.5%
Immigrants | Barbados
0.1
/100
|
#284
Tragic
82.4%