Immigrants from Indonesia vs Yakama Married-Couple Family Poverty
COMPARE
Immigrants from Indonesia
Yakama
Married-Couple Family Poverty
Married-Couple Family Poverty Comparison
Immigrants from Indonesia
Yakama
4.8%
MARRIED-COUPLE FAMILY POVERTY
95.1/ 100
METRIC RATING
114th/ 347
METRIC RANK
9.0%
MARRIED-COUPLE FAMILY POVERTY
0.0/ 100
METRIC RATING
337th/ 347
METRIC RANK
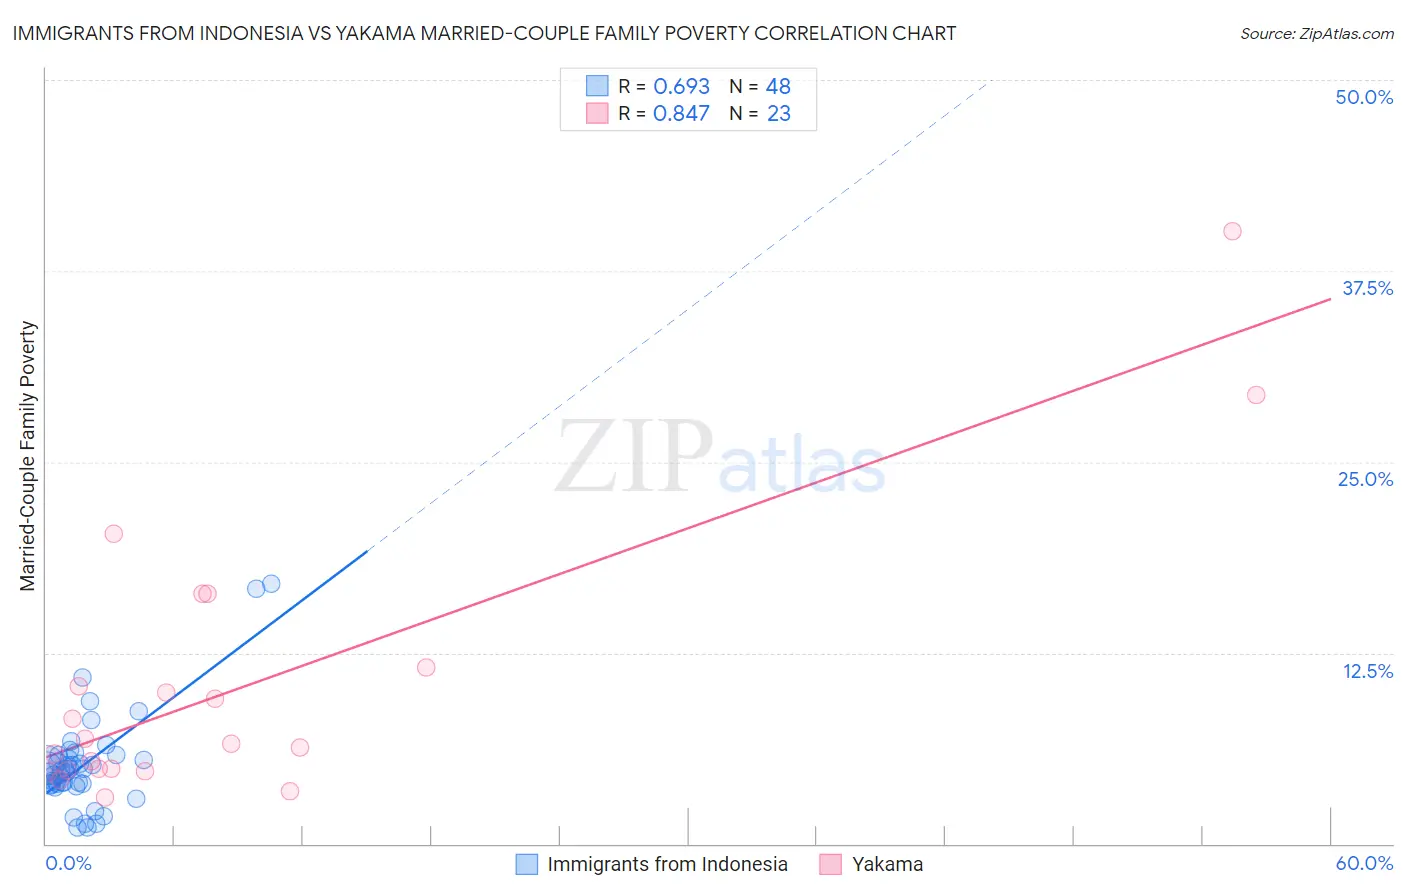
Immigrants from Indonesia vs Yakama Married-Couple Family Poverty Correlation Chart
The statistical analysis conducted on geographies consisting of 214,935,833 people shows a significant positive correlation between the proportion of Immigrants from Indonesia and poverty level among married-couple families in the United States with a correlation coefficient (R) of 0.693 and weighted average of 4.8%. Similarly, the statistical analysis conducted on geographies consisting of 19,842,420 people shows a very strong positive correlation between the proportion of Yakama and poverty level among married-couple families in the United States with a correlation coefficient (R) of 0.847 and weighted average of 9.0%, a difference of 87.8%.
Married-Couple Family Poverty Correlation Summary
| Measurement | Immigrants from Indonesia | Yakama |
| Minimum | 1.0% | 3.0% |
| Maximum | 17.0% | 40.1% |
| Range | 16.0% | 37.1% |
| Mean | 5.2% | 10.3% |
| Median | 4.9% | 6.6% |
| Interquartile 25% (IQ1) | 3.9% | 4.8% |
| Interquartile 75% (IQ3) | 5.7% | 11.5% |
| Interquartile Range (IQR) | 1.8% | 6.7% |
| Standard Deviation (Sample) | 3.2% | 9.1% |
| Standard Deviation (Population) | 3.1% | 8.9% |
Similar Demographics by Married-Couple Family Poverty
Demographics Similar to Immigrants from Indonesia by Married-Couple Family Poverty
In terms of married-couple family poverty, the demographic groups most similar to Immigrants from Indonesia are Taiwanese (4.8%, a difference of 0.15%), Celtic (4.8%, a difference of 0.16%), Kenyan (4.8%, a difference of 0.26%), Immigrants from Philippines (4.8%, a difference of 0.28%), and Immigrants from Nepal (4.7%, a difference of 0.58%).
| Demographics | Rating | Rank | Married-Couple Family Poverty |
| Immigrants | Germany | 96.8 /100 | #107 | Exceptional 4.7% |
| Laotians | 96.6 /100 | #108 | Exceptional 4.7% |
| Immigrants | Hong Kong | 96.4 /100 | #109 | Exceptional 4.7% |
| Immigrants | Bolivia | 96.2 /100 | #110 | Exceptional 4.7% |
| Pakistanis | 96.2 /100 | #111 | Exceptional 4.7% |
| Tongans | 95.9 /100 | #112 | Exceptional 4.7% |
| Immigrants | Nepal | 95.9 /100 | #113 | Exceptional 4.7% |
| Immigrants | Indonesia | 95.1 /100 | #114 | Exceptional 4.8% |
| Taiwanese | 94.8 /100 | #115 | Exceptional 4.8% |
| Celtics | 94.8 /100 | #116 | Exceptional 4.8% |
| Kenyans | 94.7 /100 | #117 | Exceptional 4.8% |
| Immigrants | Philippines | 94.6 /100 | #118 | Exceptional 4.8% |
| Immigrants | Eastern Asia | 94.0 /100 | #119 | Exceptional 4.8% |
| Immigrants | Southern Europe | 93.4 /100 | #120 | Exceptional 4.8% |
| Indians (Asian) | 93.2 /100 | #121 | Exceptional 4.8% |
Demographics Similar to Yakama by Married-Couple Family Poverty
In terms of married-couple family poverty, the demographic groups most similar to Yakama are Apache (9.0%, a difference of 0.040%), Sioux (8.7%, a difference of 3.0%), Cheyenne (9.4%, a difference of 5.3%), Immigrants from Dominican Republic (8.4%, a difference of 6.7%), and Crow (9.6%, a difference of 6.7%).
| Demographics | Rating | Rank | Married-Couple Family Poverty |
| Paiute | 0.0 /100 | #330 | Tragic 8.3% |
| Central American Indians | 0.0 /100 | #331 | Tragic 8.3% |
| Dominicans | 0.0 /100 | #332 | Tragic 8.3% |
| Lumbee | 0.0 /100 | #333 | Tragic 8.3% |
| Immigrants | Dominican Republic | 0.0 /100 | #334 | Tragic 8.4% |
| Sioux | 0.0 /100 | #335 | Tragic 8.7% |
| Apache | 0.0 /100 | #336 | Tragic 9.0% |
| Yakama | 0.0 /100 | #337 | Tragic 9.0% |
| Cheyenne | 0.0 /100 | #338 | Tragic 9.4% |
| Crow | 0.0 /100 | #339 | Tragic 9.6% |
| Yuman | 0.0 /100 | #340 | Tragic 9.7% |
| Pueblo | 0.0 /100 | #341 | Tragic 11.1% |
| Tohono O'odham | 0.0 /100 | #342 | Tragic 11.2% |
| Pima | 0.0 /100 | #343 | Tragic 11.4% |
| Navajo | 0.0 /100 | #344 | Tragic 11.9% |