Immigrants from Ireland Wage/Income Gap
COMPARE
Immigrants from Ireland
Select to Compare
Wage/Income Gap
Immigrants from Ireland Wage/Income Gap
26.9%
WAGE/INCOME GAP
6.5/ 100
METRIC RATING
225th/ 347
METRIC RANK
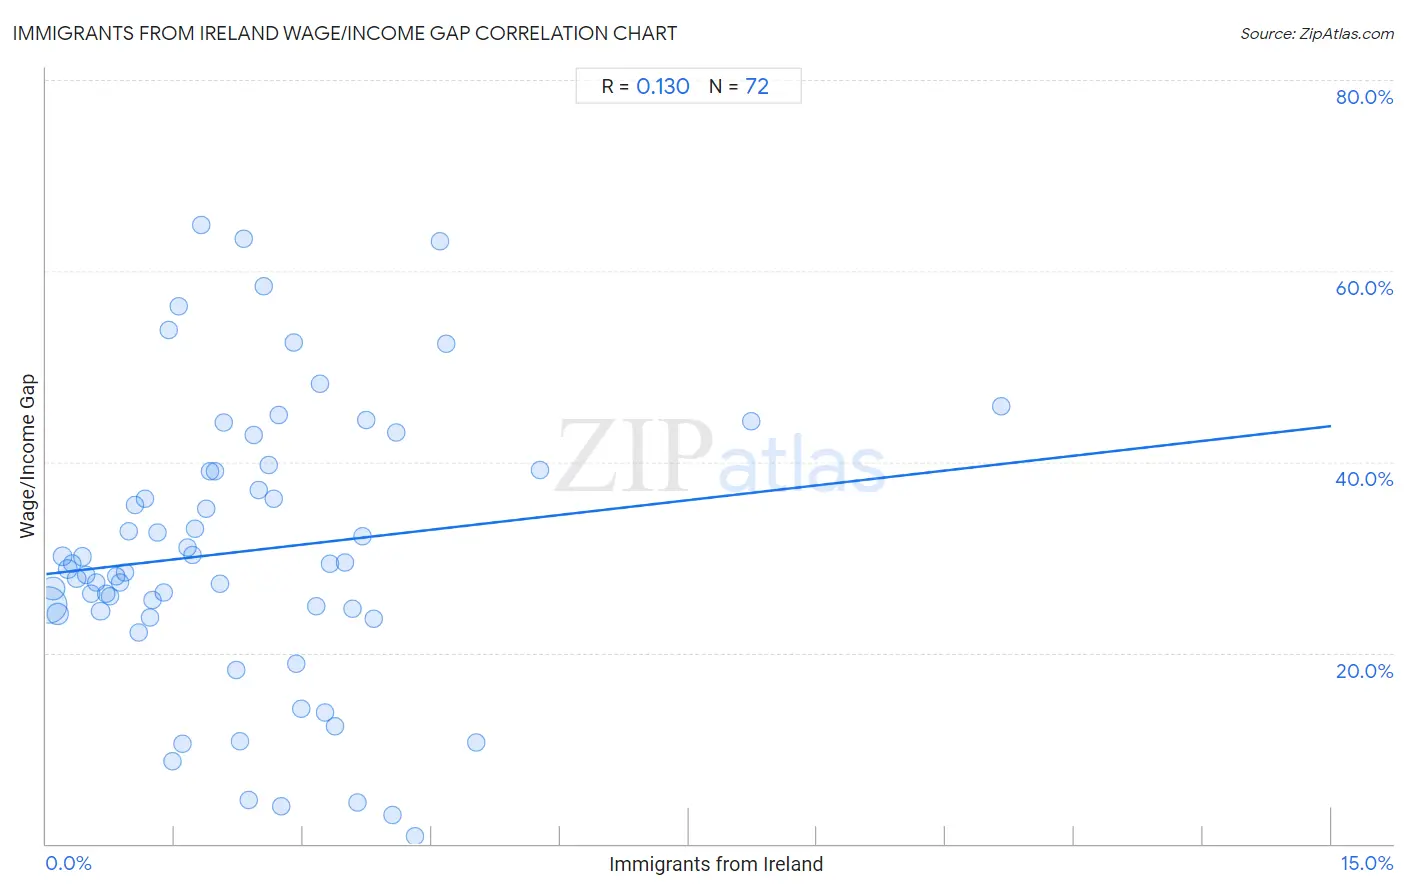
Immigrants from Ireland Wage/Income Gap Correlation Chart
The statistical analysis conducted on geographies consisting of 240,648,887 people shows a poor positive correlation between the proportion of Immigrants from Ireland and wage/income gap percentage in the United States with a correlation coefficient (R) of 0.130 and weighted average of 26.9%. On average, for every 1% (one percent) increase in Immigrants from Ireland within a typical geography, there is an increase of 1.0% in wage/income gap percentage.
It is essential to understand that the correlation between the percentage of Immigrants from Ireland and wage/income gap percentage does not imply a direct cause-and-effect relationship. It remains uncertain whether the presence of Immigrants from Ireland influences an upward or downward trend in the level of wage/income gap percentage within an area, or if Immigrants from Ireland simply ended up residing in those areas with higher or lower levels of wage/income gap percentage due to other factors.
Demographics Similar to Immigrants from Ireland by Wage/Income Gap
In terms of wage/income gap, the demographic groups most similar to Immigrants from Ireland are Immigrants from Argentina (26.8%, a difference of 0.17%), Asian (26.9%, a difference of 0.17%), Spaniard (27.0%, a difference of 0.24%), Immigrants from Turkey (27.0%, a difference of 0.25%), and Immigrants from Asia (27.0%, a difference of 0.28%).
| Demographics | Rating | Rank | Wage/Income Gap |
| Immigrants from Saudi Arabia | 9.1 /100 | #218 | Tragic 26.7% |
| Immigrants from Poland | 8.9 /100 | #219 | Tragic 26.7% |
| Immigrants from Latvia | 8.9 /100 | #220 | Tragic 26.7% |
| Immigrants from Spain | 8.5 /100 | #221 | Tragic 26.8% |
| Bolivians | 8.3 /100 | #222 | Tragic 26.8% |
| Jordanians | 8.0 /100 | #223 | Tragic 26.8% |
| Immigrants from Argentina | 7.2 /100 | #224 | Tragic 26.8% |
| Immigrants from Ireland | 6.5 /100 | #225 | Tragic 26.9% |
| Asians | 5.9 /100 | #226 | Tragic 26.9% |
| Spaniards | 5.6 /100 | #227 | Tragic 27.0% |
| Immigrants from Turkey | 5.6 /100 | #228 | Tragic 27.0% |
| Immigrants from Asia | 5.5 /100 | #229 | Tragic 27.0% |
| Ottawa | 5.3 /100 | #230 | Tragic 27.0% |
| Bhutanese | 5.3 /100 | #231 | Tragic 27.0% |
| Argentineans | 5.2 /100 | #232 | Tragic 27.0% |
Immigrants from Ireland Wage/Income Gap Correlation Summary
| Measurement | Immigrants from Ireland Data | Wage/Income Gap Data |
| Minimum | 0.024% | 0.77% |
| Maximum | 11.1% | 64.9% |
| Range | 11.1% | 64.1% |
| Mean | 2.3% | 30.6% |
| Median | 2.0% | 29.0% |
| Interquartile 25% (IQ1) | 1.0% | 24.2% |
| Interquartile 75% (IQ3) | 3.2% | 39.1% |
| Interquartile Range (IQR) | 2.2% | 14.9% |
| Standard Deviation (Sample) | 1.9% | 14.7% |
| Standard Deviation (Population) | 1.8% | 14.6% |
Correlation Details
| Immigrants from Ireland Percentile | Sample Size | Wage/Income Gap |
[ 0.0% - 0.5% ] 0.024% | 144,623,470 | 25.0% |
[ 0.0% - 0.5% ] 0.080% | 41,688,548 | 26.7% |
[ 0.0% - 0.5% ] 0.14% | 25,965,132 | 24.1% |
[ 0.0% - 0.5% ] 0.19% | 8,523,230 | 30.1% |
[ 0.0% - 0.5% ] 0.25% | 5,241,336 | 28.8% |
[ 0.0% - 0.5% ] 0.31% | 3,732,639 | 29.4% |
[ 0.0% - 0.5% ] 0.36% | 2,719,952 | 27.8% |
[ 0.0% - 0.5% ] 0.42% | 1,423,090 | 30.1% |
[ 0.0% - 0.5% ] 0.47% | 1,133,341 | 28.2% |
[ 0.5% - 1.0% ] 0.52% | 837,115 | 26.2% |
[ 0.5% - 1.0% ] 0.58% | 893,605 | 27.4% |
[ 0.5% - 1.0% ] 0.63% | 624,049 | 24.3% |
[ 0.5% - 1.0% ] 0.70% | 370,218 | 26.2% |
[ 0.5% - 1.0% ] 0.75% | 436,254 | 25.9% |
[ 0.5% - 1.0% ] 0.81% | 386,577 | 28.0% |
[ 0.5% - 1.0% ] 0.86% | 347,135 | 27.3% |
[ 0.5% - 1.0% ] 0.92% | 79,953 | 28.4% |
[ 0.5% - 1.0% ] 0.97% | 118,500 | 32.8% |
[ 1.0% - 1.5% ] 1.04% | 143,553 | 35.4% |
[ 1.0% - 1.5% ] 1.08% | 265,114 | 22.1% |
[ 1.0% - 1.5% ] 1.16% | 75,402 | 36.1% |
[ 1.0% - 1.5% ] 1.21% | 283,585 | 23.7% |
[ 1.0% - 1.5% ] 1.24% | 97,811 | 25.5% |
[ 1.0% - 1.5% ] 1.30% | 86,370 | 32.6% |
[ 1.0% - 1.5% ] 1.37% | 56,067 | 26.4% |
[ 1.0% - 1.5% ] 1.42% | 28,596 | 53.8% |
[ 1.0% - 1.5% ] 1.47% | 43,264 | 8.7% |
[ 1.5% - 2.0% ] 1.54% | 57,181 | 56.4% |
[ 1.5% - 2.0% ] 1.60% | 14,032 | 10.4% |
[ 1.5% - 2.0% ] 1.65% | 13,221 | 31.1% |
[ 1.5% - 2.0% ] 1.71% | 16,745 | 30.2% |
[ 1.5% - 2.0% ] 1.74% | 39,141 | 33.0% |
[ 1.5% - 2.0% ] 1.81% | 5,808 | 64.9% |
[ 1.5% - 2.0% ] 1.86% | 28,689 | 35.1% |
[ 1.5% - 2.0% ] 1.91% | 28,787 | 39.0% |
[ 1.5% - 2.0% ] 1.96% | 9,062 | 39.0% |
[ 2.0% - 2.5% ] 2.03% | 3,736 | 27.2% |
[ 2.0% - 2.5% ] 2.08% | 6,312 | 44.1% |
[ 2.0% - 2.5% ] 2.22% | 2,616 | 18.2% |
[ 2.0% - 2.5% ] 2.25% | 754 | 10.7% |
[ 2.0% - 2.5% ] 2.30% | 304 | 63.4% |
[ 2.0% - 2.5% ] 2.36% | 9,856 | 4.6% |
[ 2.0% - 2.5% ] 2.42% | 4,466 | 42.8% |
[ 2.0% - 2.5% ] 2.48% | 1,493 | 37.0% |
[ 2.5% - 3.0% ] 2.53% | 5,013 | 58.3% |
[ 2.5% - 3.0% ] 2.60% | 6,011 | 39.7% |
[ 2.5% - 3.0% ] 2.66% | 29,959 | 36.2% |
[ 2.5% - 3.0% ] 2.72% | 2,799 | 44.9% |
[ 2.5% - 3.0% ] 2.74% | 7,307 | 3.9% |
[ 2.5% - 3.0% ] 2.89% | 3,809 | 52.5% |
[ 2.5% - 3.0% ] 2.92% | 857 | 18.8% |
[ 2.5% - 3.0% ] 2.97% | 20,306 | 14.2% |
[ 3.0% - 3.5% ] 3.16% | 7,508 | 24.9% |
[ 3.0% - 3.5% ] 3.20% | 2,812 | 48.1% |
[ 3.0% - 3.5% ] 3.26% | 399 | 13.8% |
[ 3.0% - 3.5% ] 3.31% | 8,872 | 29.3% |
[ 3.0% - 3.5% ] 3.37% | 297 | 12.4% |
[ 3.0% - 3.5% ] 3.49% | 15,666 | 29.5% |
[ 3.5% - 4.0% ] 3.58% | 2,041 | 24.6% |
[ 3.5% - 4.0% ] 3.64% | 1,292 | 4.4% |
[ 3.5% - 4.0% ] 3.70% | 16,426 | 32.2% |
[ 3.5% - 4.0% ] 3.74% | 3,828 | 44.3% |
[ 3.5% - 4.0% ] 3.83% | 575 | 23.6% |
[ 4.0% - 4.5% ] 4.05% | 7,312 | 3.0% |
[ 4.0% - 4.5% ] 4.09% | 318 | 43.0% |
[ 4.0% - 4.5% ] 4.30% | 186 | 0.77% |
[ 4.5% - 5.0% ] 4.59% | 2,047 | 63.2% |
[ 4.5% - 5.0% ] 4.67% | 793 | 52.4% |
[ 5.0% - 5.5% ] 5.01% | 33,019 | 10.7% |
[ 5.5% - 6.0% ] 5.76% | 191 | 39.1% |
[ 8.0% - 8.5% ] 8.24% | 595 | 44.3% |
[ 11.0% - 11.5% ] 11.14% | 2,540 | 45.8% |