Immigrants from Afghanistan Wage/Income Gap
COMPARE
Immigrants from Afghanistan
Select to Compare
Wage/Income Gap
Immigrants from Afghanistan Wage/Income Gap
24.4%
WAGE/INCOME GAP
95.9/ 100
METRIC RATING
117th/ 347
METRIC RANK
Immigrants from Afghanistan Wage/Income Gap Correlation Chart
The statistical analysis conducted on geographies consisting of 147,636,341 people shows a mild negative correlation between the proportion of Immigrants from Afghanistan and wage/income gap percentage in the United States with a correlation coefficient (R) of -0.308 and weighted average of 24.4%. On average, for every 1% (one percent) increase in Immigrants from Afghanistan within a typical geography, there is a decrease of 1.4% in wage/income gap percentage.
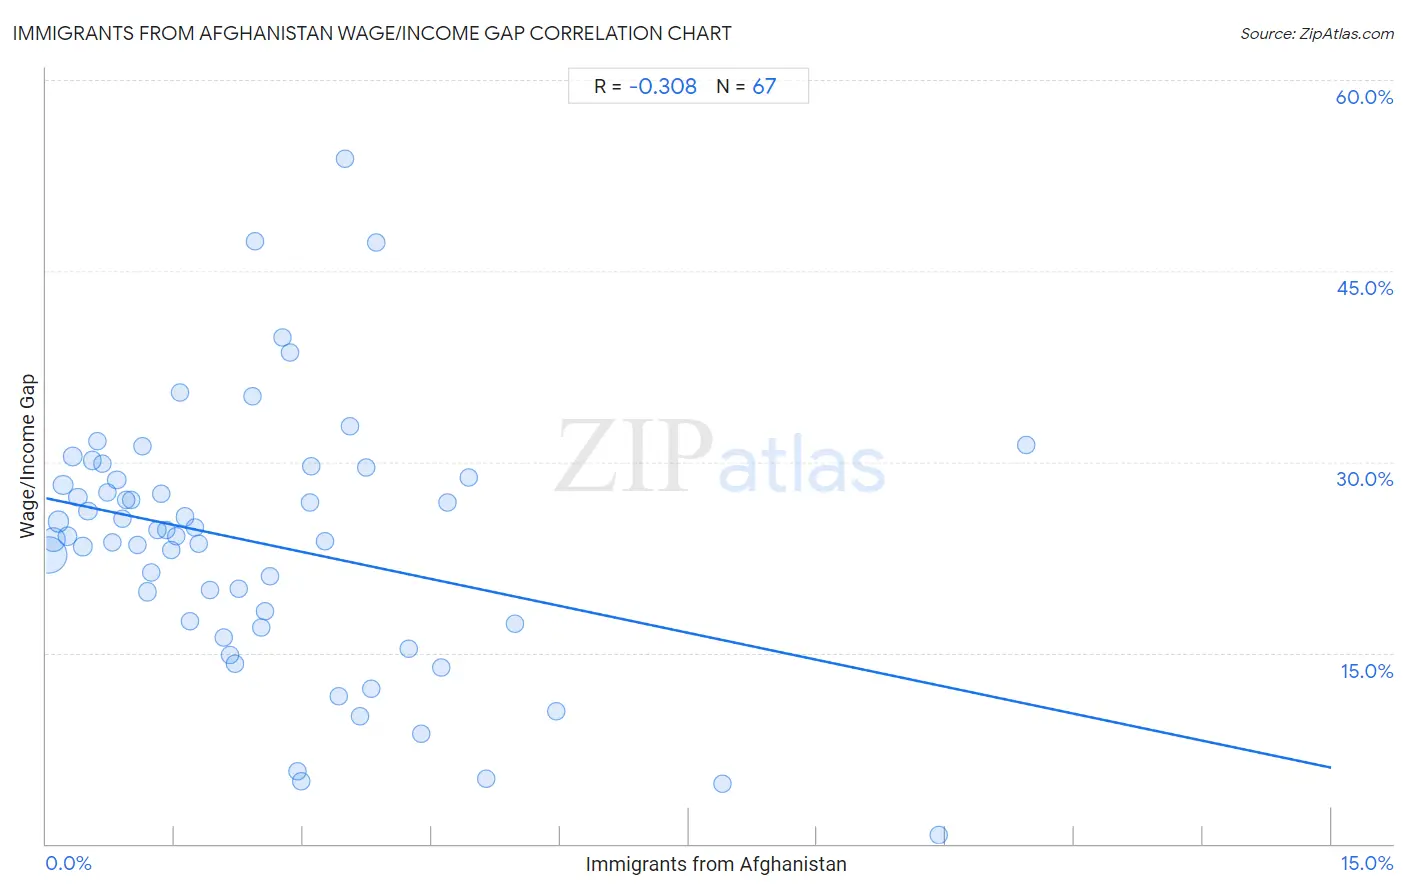
It is essential to understand that the correlation between the percentage of Immigrants from Afghanistan and wage/income gap percentage does not imply a direct cause-and-effect relationship. It remains uncertain whether the presence of Immigrants from Afghanistan influences an upward or downward trend in the level of wage/income gap percentage within an area, or if Immigrants from Afghanistan simply ended up residing in those areas with higher or lower levels of wage/income gap percentage due to other factors.
Demographics Similar to Immigrants from Afghanistan by Wage/Income Gap
In terms of wage/income gap, the demographic groups most similar to Immigrants from Afghanistan are Immigrants from Micronesia (24.4%, a difference of 0.030%), Kenyan (24.5%, a difference of 0.050%), Alaska Native (24.4%, a difference of 0.060%), Cree (24.5%, a difference of 0.13%), and Immigrants from Kenya (24.4%, a difference of 0.23%).
| Demographics | Rating | Rank | Wage/Income Gap |
| Immigrants from Morocco | 98.1 /100 | #110 | Exceptional 24.1% |
| Soviet Union | 97.6 /100 | #111 | Exceptional 24.2% |
| Immigrants from Colombia | 97.0 /100 | #112 | Exceptional 24.3% |
| Sioux | 96.9 /100 | #113 | Exceptional 24.3% |
| Panamanians | 96.5 /100 | #114 | Exceptional 24.4% |
| Immigrants from Kenya | 96.4 /100 | #115 | Exceptional 24.4% |
| Alaska Natives | 96.0 /100 | #116 | Exceptional 24.4% |
| Immigrants from Afghanistan | 95.9 /100 | #117 | Exceptional 24.4% |
| Immigrants from Micronesia | 95.8 /100 | #118 | Exceptional 24.4% |
| Kenyans | 95.8 /100 | #119 | Exceptional 24.5% |
| Cree | 95.6 /100 | #120 | Exceptional 24.5% |
| Immigrants from Thailand | 94.9 /100 | #121 | Exceptional 24.5% |
| Apache | 94.8 /100 | #122 | Exceptional 24.5% |
| Natives/Alaskans | 94.6 /100 | #123 | Exceptional 24.6% |
| Immigrants from South America | 93.9 /100 | #124 | Exceptional 24.6% |
Immigrants from Afghanistan Wage/Income Gap Correlation Summary
| Measurement | Immigrants from Afghanistan Data | Wage/Income Gap Data |
| Minimum | 0.029% | 0.66% |
| Maximum | 11.4% | 53.8% |
| Range | 11.4% | 53.1% |
| Mean | 2.5% | 23.6% |
| Median | 2.1% | 24.1% |
| Interquartile 25% (IQ1) | 0.93% | 17.3% |
| Interquartile 75% (IQ3) | 3.5% | 28.8% |
| Interquartile Range (IQR) | 2.5% | 11.5% |
| Standard Deviation (Sample) | 2.2% | 10.1% |
| Standard Deviation (Population) | 2.2% | 10.1% |
Correlation Details
| Immigrants from Afghanistan Percentile | Sample Size | Wage/Income Gap |
[ 0.0% - 0.5% ] 0.029% | 75,099,764 | 22.6% |
[ 0.0% - 0.5% ] 0.083% | 28,196,250 | 23.9% |
[ 0.0% - 0.5% ] 0.14% | 12,728,031 | 25.3% |
[ 0.0% - 0.5% ] 0.20% | 5,324,337 | 28.2% |
[ 0.0% - 0.5% ] 0.25% | 5,071,737 | 24.1% |
[ 0.0% - 0.5% ] 0.31% | 3,219,570 | 30.4% |
[ 0.0% - 0.5% ] 0.37% | 2,334,602 | 27.2% |
[ 0.0% - 0.5% ] 0.43% | 2,143,369 | 23.3% |
[ 0.0% - 0.5% ] 0.49% | 1,393,837 | 26.1% |
[ 0.5% - 1.0% ] 0.54% | 1,604,907 | 30.1% |
[ 0.5% - 1.0% ] 0.60% | 785,903 | 31.6% |
[ 0.5% - 1.0% ] 0.66% | 785,853 | 29.9% |
[ 0.5% - 1.0% ] 0.71% | 854,084 | 27.6% |
[ 0.5% - 1.0% ] 0.77% | 918,249 | 23.7% |
[ 0.5% - 1.0% ] 0.82% | 926,389 | 28.6% |
[ 0.5% - 1.0% ] 0.89% | 276,819 | 25.5% |
[ 0.5% - 1.0% ] 0.93% | 694,275 | 27.0% |
[ 0.5% - 1.0% ] 0.99% | 526,494 | 27.0% |
[ 1.0% - 1.5% ] 1.06% | 580,772 | 23.5% |
[ 1.0% - 1.5% ] 1.12% | 369,324 | 31.2% |
[ 1.0% - 1.5% ] 1.18% | 576,312 | 19.8% |
[ 1.0% - 1.5% ] 1.23% | 194,636 | 21.3% |
[ 1.0% - 1.5% ] 1.30% | 301,238 | 24.6% |
[ 1.0% - 1.5% ] 1.35% | 177,016 | 27.5% |
[ 1.0% - 1.5% ] 1.40% | 182,752 | 24.6% |
[ 1.0% - 1.5% ] 1.45% | 156,284 | 23.1% |
[ 1.5% - 2.0% ] 1.52% | 162,757 | 24.1% |
[ 1.5% - 2.0% ] 1.56% | 158,976 | 35.5% |
[ 1.5% - 2.0% ] 1.62% | 149,493 | 25.7% |
[ 1.5% - 2.0% ] 1.68% | 157,625 | 17.5% |
[ 1.5% - 2.0% ] 1.74% | 153,547 | 24.8% |
[ 1.5% - 2.0% ] 1.78% | 96,788 | 23.5% |
[ 1.5% - 2.0% ] 1.91% | 161,077 | 19.9% |
[ 2.0% - 2.5% ] 2.08% | 127,855 | 16.2% |
[ 2.0% - 2.5% ] 2.14% | 85,679 | 14.8% |
[ 2.0% - 2.5% ] 2.20% | 29,846 | 14.2% |
[ 2.0% - 2.5% ] 2.25% | 90,052 | 20.0% |
[ 2.0% - 2.5% ] 2.40% | 5,416 | 35.1% |
[ 2.0% - 2.5% ] 2.44% | 1,680 | 47.4% |
[ 2.5% - 3.0% ] 2.51% | 36,335 | 17.0% |
[ 2.5% - 3.0% ] 2.55% | 63,715 | 18.3% |
[ 2.5% - 3.0% ] 2.61% | 51,346 | 21.0% |
[ 2.5% - 3.0% ] 2.76% | 59,702 | 39.8% |
[ 2.5% - 3.0% ] 2.85% | 45,296 | 38.6% |
[ 2.5% - 3.0% ] 2.93% | 23,756 | 5.7% |
[ 2.5% - 3.0% ] 2.97% | 19,531 | 4.9% |
[ 3.0% - 3.5% ] 3.09% | 35,458 | 26.8% |
[ 3.0% - 3.5% ] 3.10% | 1,936 | 29.6% |
[ 3.0% - 3.5% ] 3.26% | 50,028 | 23.7% |
[ 3.0% - 3.5% ] 3.42% | 3,303 | 11.5% |
[ 3.0% - 3.5% ] 3.48% | 10,400 | 53.8% |
[ 3.5% - 4.0% ] 3.55% | 18,080 | 32.8% |
[ 3.5% - 4.0% ] 3.66% | 3,085 | 10.0% |
[ 3.5% - 4.0% ] 3.73% | 7,770 | 29.5% |
[ 3.5% - 4.0% ] 3.79% | 39,126 | 12.2% |
[ 3.5% - 4.0% ] 3.85% | 12,840 | 47.2% |
[ 4.0% - 4.5% ] 4.23% | 37,635 | 15.3% |
[ 4.0% - 4.5% ] 4.38% | 63,907 | 8.6% |
[ 4.5% - 5.0% ] 4.61% | 16,050 | 13.8% |
[ 4.5% - 5.0% ] 4.69% | 37,310 | 26.8% |
[ 4.5% - 5.0% ] 4.93% | 345 | 28.8% |
[ 5.0% - 5.5% ] 5.13% | 24,785 | 5.1% |
[ 5.0% - 5.5% ] 5.47% | 96,076 | 17.3% |
[ 5.5% - 6.0% ] 5.95% | 34,082 | 10.4% |
[ 7.5% - 8.0% ] 7.90% | 37,436 | 4.7% |
[ 10.0% - 10.5% ] 10.42% | 1,200 | 0.66% |
[ 11.0% - 11.5% ] 11.43% | 2,213 | 31.3% |