White/Caucasian Wage/Income Gap
COMPARE
White/Caucasian
Select to Compare
Wage/Income Gap
White/Caucasian Wage/Income Gap
28.5%
WAGE/INCOME GAP
0.1/ 100
METRIC RATING
306th/ 347
METRIC RANK
White/Caucasian Wage/Income Gap Correlation Chart
The statistical analysis conducted on geographies consisting of 580,089,064 people shows a perfect positive correlation between the proportion of Whites/Caucasians and wage/income gap percentage in the United States with a correlation coefficient (R) of 0.954 and weighted average of 28.5%. On average, for every 1% (one percent) increase in Whites/Caucasians within a typical geography, there is an increase of 0.20% in wage/income gap percentage.
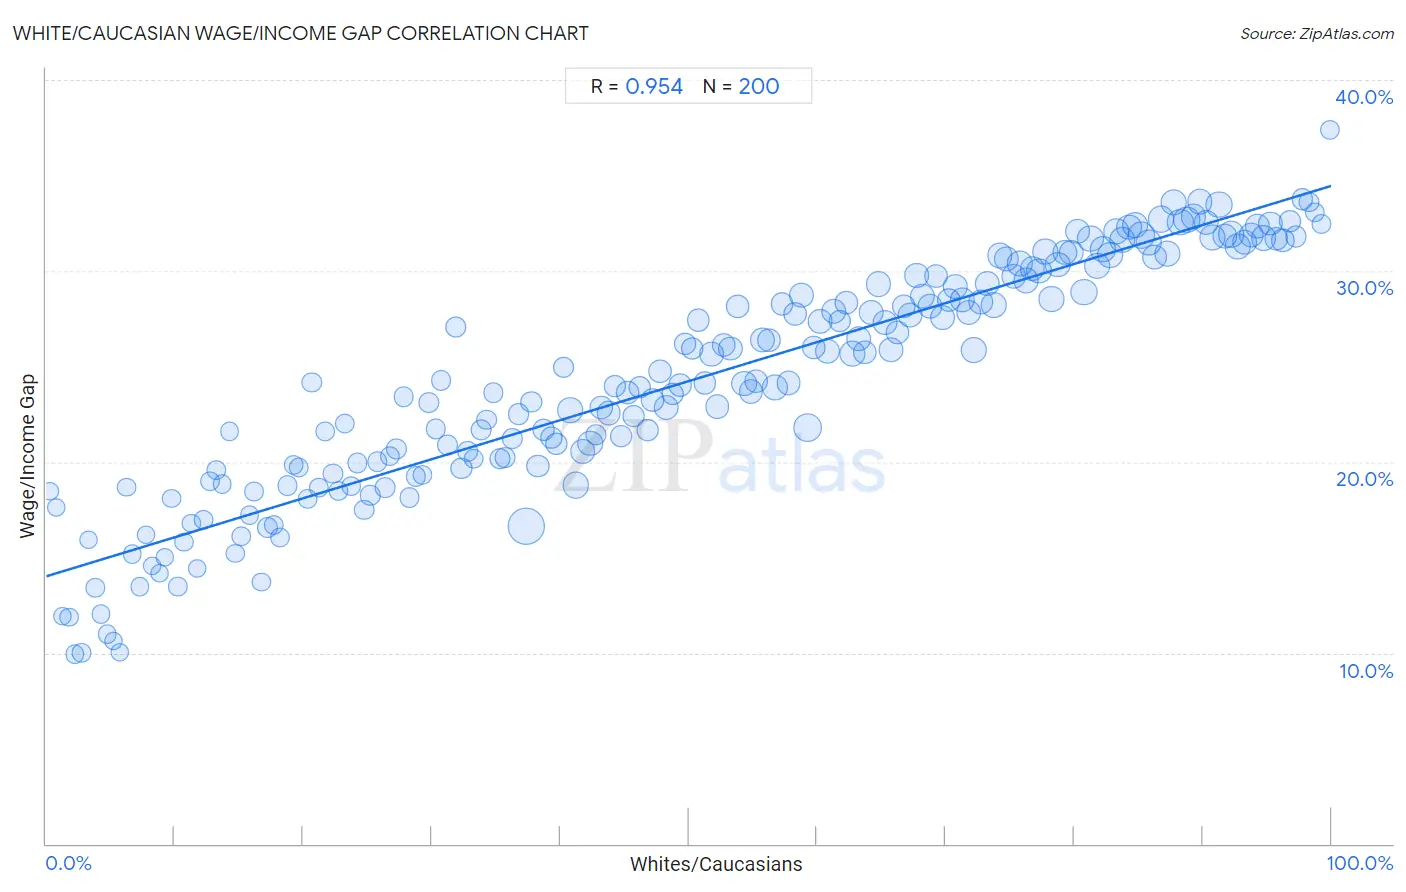
It is essential to understand that the correlation between the percentage of Whites/Caucasians and wage/income gap percentage does not imply a direct cause-and-effect relationship. It remains uncertain whether the presence of Whites/Caucasians influences an upward or downward trend in the level of wage/income gap percentage within an area, or if Whites/Caucasians simply ended up residing in those areas with higher or lower levels of wage/income gap percentage due to other factors.
Demographics Similar to Whites/Caucasians by Wage/Income Gap
In terms of wage/income gap, the demographic groups most similar to Whites/Caucasians are Immigrants from Denmark (28.5%, a difference of 0.010%), Immigrants from South Africa (28.5%, a difference of 0.050%), Immigrants from Netherlands (28.5%, a difference of 0.060%), Polish (28.5%, a difference of 0.080%), and Scotch-Irish (28.5%, a difference of 0.14%).
| Demographics | Rating | Rank | Wage/Income Gap |
| Immigrants from North Macedonia | 0.2 /100 | #299 | Tragic 28.4% |
| Immigrants from Northern Europe | 0.2 /100 | #300 | Tragic 28.5% |
| Immigrants from Canada | 0.2 /100 | #301 | Tragic 28.5% |
| Scotch-Irish | 0.2 /100 | #302 | Tragic 28.5% |
| Irish | 0.2 /100 | #303 | Tragic 28.5% |
| Immigrants from Netherlands | 0.2 /100 | #304 | Tragic 28.5% |
| Immigrants from South Africa | 0.1 /100 | #305 | Tragic 28.5% |
| Whites/Caucasians | 0.1 /100 | #306 | Tragic 28.5% |
| Immigrants from Denmark | 0.1 /100 | #307 | Tragic 28.5% |
| Poles | 0.1 /100 | #308 | Tragic 28.5% |
| Macedonians | 0.1 /100 | #309 | Tragic 28.6% |
| Finns | 0.1 /100 | #310 | Tragic 28.6% |
| Immigrants from Lithuania | 0.1 /100 | #311 | Tragic 28.6% |
| Eastern Europeans | 0.1 /100 | #312 | Tragic 28.6% |
| French | 0.1 /100 | #313 | Tragic 28.7% |
White/Caucasian Wage/Income Gap Correlation Summary
| Measurement | White/Caucasian Data | Wage/Income Gap Data |
| Minimum | 0.32% | 9.9% |
| Maximum | 99.9% | 37.4% |
| Range | 99.6% | 27.5% |
| Mean | 50.0% | 24.2% |
| Median | 50.0% | 24.1% |
| Interquartile 25% (IQ1) | 25.0% | 19.6% |
| Interquartile 75% (IQ3) | 75.0% | 29.7% |
| Interquartile Range (IQR) | 50.0% | 10.1% |
| Standard Deviation (Sample) | 28.9% | 6.2% |
| Standard Deviation (Population) | 28.9% | 6.2% |
Correlation Details
| White/Caucasian Percentile | Sample Size | Wage/Income Gap |
[ 0.0% - 0.5% ] 0.32% | 59,657 | 18.4% |
[ 0.5% - 1.0% ] 0.79% | 60,805 | 17.6% |
[ 1.0% - 1.5% ] 1.26% | 170,485 | 11.9% |
[ 1.5% - 2.0% ] 1.77% | 461,328 | 11.9% |
[ 2.0% - 2.5% ] 2.21% | 301,752 | 9.9% |
[ 2.5% - 3.0% ] 2.76% | 527,199 | 10.0% |
[ 3.0% - 3.5% ] 3.26% | 346,919 | 15.9% |
[ 3.5% - 4.0% ] 3.80% | 504,208 | 13.4% |
[ 4.0% - 4.5% ] 4.25% | 457,316 | 12.0% |
[ 4.5% - 5.0% ] 4.75% | 425,939 | 11.0% |
[ 5.0% - 5.5% ] 5.23% | 433,014 | 10.6% |
[ 5.5% - 6.0% ] 5.75% | 360,141 | 10.0% |
[ 6.0% - 6.5% ] 6.27% | 450,512 | 18.7% |
[ 6.5% - 7.0% ] 6.68% | 425,191 | 15.2% |
[ 7.0% - 7.5% ] 7.30% | 352,493 | 13.5% |
[ 7.5% - 8.0% ] 7.78% | 338,396 | 16.2% |
[ 8.0% - 8.5% ] 8.24% | 567,532 | 14.6% |
[ 8.5% - 9.0% ] 8.81% | 668,256 | 14.2% |
[ 9.0% - 9.5% ] 9.25% | 383,585 | 15.0% |
[ 9.5% - 10.0% ] 9.74% | 489,959 | 18.1% |
[ 10.0% - 10.5% ] 10.22% | 432,774 | 13.5% |
[ 10.5% - 11.0% ] 10.73% | 507,010 | 15.8% |
[ 11.0% - 11.5% ] 11.27% | 716,005 | 16.8% |
[ 11.5% - 12.0% ] 11.75% | 469,167 | 14.4% |
[ 12.0% - 12.5% ] 12.21% | 1,174,972 | 17.0% |
[ 12.5% - 13.0% ] 12.75% | 901,007 | 19.0% |
[ 13.0% - 13.5% ] 13.27% | 793,120 | 19.6% |
[ 13.5% - 14.0% ] 13.70% | 429,701 | 18.8% |
[ 14.0% - 14.5% ] 14.27% | 709,227 | 21.6% |
[ 14.5% - 15.0% ] 14.71% | 504,395 | 15.2% |
[ 15.0% - 15.5% ] 15.17% | 870,710 | 16.1% |
[ 15.5% - 16.0% ] 15.81% | 703,065 | 17.2% |
[ 16.0% - 16.5% ] 16.15% | 538,383 | 18.5% |
[ 16.5% - 17.0% ] 16.76% | 680,908 | 13.7% |
[ 17.0% - 17.5% ] 17.25% | 1,691,427 | 16.5% |
[ 17.5% - 18.0% ] 17.71% | 877,445 | 16.7% |
[ 18.0% - 18.5% ] 18.21% | 918,095 | 16.0% |
[ 18.5% - 19.0% ] 18.75% | 951,243 | 18.8% |
[ 19.0% - 19.5% ] 19.26% | 998,576 | 19.8% |
[ 19.5% - 20.0% ] 19.69% | 906,372 | 19.7% |
[ 20.0% - 20.5% ] 20.31% | 754,306 | 18.0% |
[ 20.5% - 21.0% ] 20.67% | 991,808 | 24.2% |
[ 21.0% - 21.5% ] 21.23% | 735,223 | 18.6% |
[ 21.5% - 22.0% ] 21.70% | 686,548 | 21.6% |
[ 22.0% - 22.5% ] 22.31% | 1,088,423 | 19.4% |
[ 22.5% - 23.0% ] 22.71% | 1,274,195 | 18.5% |
[ 23.0% - 23.5% ] 23.23% | 1,192,558 | 22.0% |
[ 23.5% - 24.0% ] 23.75% | 1,051,979 | 18.7% |
[ 24.0% - 24.5% ] 24.24% | 1,076,067 | 19.9% |
[ 24.5% - 25.0% ] 24.75% | 1,119,483 | 17.5% |
[ 25.0% - 25.5% ] 25.23% | 1,367,040 | 18.2% |
[ 25.5% - 26.0% ] 25.75% | 1,163,130 | 20.0% |
[ 26.0% - 26.5% ] 26.33% | 1,584,320 | 18.6% |
[ 26.5% - 27.0% ] 26.74% | 1,051,604 | 20.3% |
[ 27.0% - 27.5% ] 27.26% | 1,467,231 | 20.7% |
[ 27.5% - 28.0% ] 27.81% | 1,025,644 | 23.4% |
[ 28.0% - 28.5% ] 28.27% | 1,643,681 | 18.1% |
[ 28.5% - 29.0% ] 28.77% | 1,417,497 | 19.2% |
[ 29.0% - 29.5% ] 29.28% | 987,570 | 19.3% |
[ 29.5% - 30.0% ] 29.74% | 1,613,987 | 23.1% |
[ 30.0% - 30.5% ] 30.32% | 1,523,065 | 21.7% |
[ 30.5% - 31.0% ] 30.75% | 1,172,333 | 24.3% |
[ 31.0% - 31.5% ] 31.24% | 1,696,325 | 20.9% |
[ 31.5% - 32.0% ] 31.87% | 2,361,032 | 27.1% |
[ 32.0% - 32.5% ] 32.29% | 2,337,116 | 19.7% |
[ 32.5% - 33.0% ] 32.77% | 1,591,571 | 20.6% |
[ 33.0% - 33.5% ] 33.27% | 942,095 | 20.2% |
[ 33.5% - 34.0% ] 33.82% | 1,882,444 | 21.6% |
[ 34.0% - 34.5% ] 34.27% | 1,165,958 | 22.2% |
[ 34.5% - 35.0% ] 34.79% | 1,429,435 | 23.6% |
[ 35.0% - 35.5% ] 35.27% | 1,818,170 | 20.1% |
[ 35.5% - 36.0% ] 35.73% | 1,654,072 | 20.2% |
[ 36.0% - 36.5% ] 36.25% | 1,962,045 | 21.2% |
[ 36.5% - 37.0% ] 36.75% | 2,017,168 | 22.5% |
[ 37.0% - 37.5% ] 37.37% | 12,676,285 | 16.6% |
[ 37.5% - 38.0% ] 37.71% | 2,479,820 | 23.1% |
[ 38.0% - 38.5% ] 38.24% | 2,881,506 | 19.8% |
[ 38.5% - 39.0% ] 38.72% | 2,808,347 | 21.7% |
[ 39.0% - 39.5% ] 39.28% | 2,408,632 | 21.3% |
[ 39.5% - 40.0% ] 39.72% | 2,511,457 | 21.0% |
[ 40.0% - 40.5% ] 40.24% | 2,003,936 | 25.0% |
[ 40.5% - 41.0% ] 40.78% | 4,859,131 | 22.7% |
[ 41.0% - 41.5% ] 41.21% | 5,711,663 | 18.8% |
[ 41.5% - 42.0% ] 41.77% | 4,009,279 | 20.6% |
[ 42.0% - 42.5% ] 42.32% | 4,842,807 | 21.0% |
[ 42.5% - 43.0% ] 42.76% | 2,118,686 | 21.4% |
[ 43.0% - 43.5% ] 43.19% | 3,443,894 | 22.9% |
[ 43.5% - 44.0% ] 43.79% | 3,474,180 | 22.6% |
[ 44.0% - 44.5% ] 44.24% | 2,764,074 | 24.0% |
[ 44.5% - 45.0% ] 44.74% | 2,720,738 | 21.3% |
[ 45.0% - 45.5% ] 45.27% | 3,309,225 | 23.6% |
[ 45.5% - 46.0% ] 45.71% | 2,776,186 | 22.4% |
[ 46.0% - 46.5% ] 46.21% | 2,972,816 | 23.9% |
[ 46.5% - 47.0% ] 46.77% | 2,387,461 | 21.7% |
[ 47.0% - 47.5% ] 47.21% | 3,352,847 | 23.2% |
[ 47.5% - 48.0% ] 47.75% | 3,355,043 | 24.7% |
[ 48.0% - 48.5% ] 48.24% | 4,297,643 | 22.9% |
[ 48.5% - 49.0% ] 48.73% | 2,400,320 | 23.6% |
[ 49.0% - 49.5% ] 49.29% | 3,327,342 | 24.0% |
[ 49.5% - 50.0% ] 49.74% | 2,470,975 | 26.2% |
[ 50.0% - 50.5% ] 50.26% | 2,949,867 | 25.9% |
[ 50.5% - 51.0% ] 50.75% | 3,209,053 | 27.4% |
[ 51.0% - 51.5% ] 51.23% | 2,798,579 | 24.1% |
[ 51.5% - 52.0% ] 51.79% | 3,768,841 | 25.6% |
[ 52.0% - 52.5% ] 52.20% | 3,788,702 | 22.9% |
[ 52.5% - 53.0% ] 52.76% | 3,451,546 | 26.1% |
[ 53.0% - 53.5% ] 53.23% | 3,660,343 | 25.9% |
[ 53.5% - 54.0% ] 53.78% | 3,217,685 | 28.1% |
[ 54.0% - 54.5% ] 54.32% | 4,570,636 | 24.1% |
[ 54.5% - 55.0% ] 54.82% | 3,919,005 | 23.7% |
[ 55.0% - 55.5% ] 55.28% | 3,498,119 | 24.2% |
[ 55.5% - 56.0% ] 55.75% | 4,328,401 | 26.4% |
[ 56.0% - 56.5% ] 56.24% | 3,115,852 | 26.4% |
[ 56.5% - 57.0% ] 56.71% | 5,196,393 | 23.9% |
[ 57.0% - 57.5% ] 57.25% | 3,195,591 | 28.2% |
[ 57.5% - 58.0% ] 57.74% | 3,627,683 | 24.1% |
[ 58.0% - 58.5% ] 58.26% | 3,206,067 | 27.8% |
[ 58.5% - 59.0% ] 58.75% | 4,037,502 | 28.7% |
[ 59.0% - 59.5% ] 59.26% | 6,609,650 | 21.8% |
[ 59.5% - 60.0% ] 59.75% | 3,425,615 | 26.0% |
[ 60.0% - 60.5% ] 60.24% | 4,096,461 | 27.3% |
[ 60.5% - 61.0% ] 60.76% | 4,271,041 | 25.8% |
[ 61.0% - 61.5% ] 61.31% | 4,258,260 | 27.9% |
[ 61.5% - 62.0% ] 61.77% | 2,868,989 | 27.4% |
[ 62.0% - 62.5% ] 62.23% | 3,269,065 | 28.4% |
[ 62.5% - 63.0% ] 62.76% | 5,269,275 | 25.7% |
[ 63.0% - 63.5% ] 63.24% | 4,332,295 | 26.5% |
[ 63.5% - 64.0% ] 63.72% | 3,654,347 | 25.8% |
[ 64.0% - 64.5% ] 64.23% | 4,350,913 | 27.8% |
[ 64.5% - 65.0% ] 64.76% | 4,642,633 | 29.3% |
[ 65.0% - 65.5% ] 65.30% | 4,186,703 | 27.3% |
[ 65.5% - 66.0% ] 65.73% | 4,570,491 | 25.9% |
[ 66.0% - 66.5% ] 66.26% | 3,493,776 | 26.8% |
[ 66.5% - 67.0% ] 66.78% | 3,359,547 | 28.2% |
[ 67.0% - 67.5% ] 67.25% | 4,199,345 | 27.7% |
[ 67.5% - 68.0% ] 67.75% | 3,703,212 | 29.8% |
[ 68.0% - 68.5% ] 68.23% | 4,353,088 | 28.7% |
[ 68.5% - 69.0% ] 68.77% | 4,348,763 | 28.2% |
[ 69.0% - 69.5% ] 69.23% | 3,708,719 | 29.7% |
[ 69.5% - 70.0% ] 69.76% | 4,173,000 | 27.5% |
[ 70.0% - 70.5% ] 70.24% | 3,337,683 | 28.5% |
[ 70.5% - 71.0% ] 70.73% | 3,840,124 | 29.2% |
[ 71.0% - 71.5% ] 71.27% | 4,494,983 | 28.5% |
[ 71.5% - 72.0% ] 71.76% | 4,296,807 | 27.8% |
[ 72.0% - 72.5% ] 72.23% | 5,035,431 | 25.8% |
[ 72.5% - 73.0% ] 72.72% | 4,921,308 | 28.4% |
[ 73.0% - 73.5% ] 73.26% | 4,560,721 | 29.3% |
[ 73.5% - 74.0% ] 73.74% | 5,090,668 | 28.2% |
[ 74.0% - 74.5% ] 74.24% | 4,478,996 | 30.8% |
[ 74.5% - 75.0% ] 74.75% | 4,067,228 | 30.7% |
[ 75.0% - 75.5% ] 75.27% | 4,259,673 | 29.7% |
[ 75.5% - 76.0% ] 75.73% | 5,323,208 | 30.4% |
[ 76.0% - 76.5% ] 76.24% | 4,488,683 | 29.5% |
[ 76.5% - 77.0% ] 76.75% | 4,439,326 | 30.1% |
[ 77.0% - 77.5% ] 77.25% | 4,782,816 | 30.0% |
[ 77.5% - 78.0% ] 77.75% | 4,723,305 | 31.0% |
[ 78.0% - 78.5% ] 78.26% | 4,750,471 | 28.5% |
[ 78.5% - 79.0% ] 78.74% | 4,791,461 | 30.3% |
[ 79.0% - 79.5% ] 79.24% | 4,382,124 | 31.0% |
[ 79.5% - 80.0% ] 79.75% | 4,246,901 | 31.0% |
[ 80.0% - 80.5% ] 80.25% | 4,166,986 | 32.1% |
[ 80.5% - 81.0% ] 80.75% | 5,595,316 | 28.9% |
[ 81.0% - 81.5% ] 81.26% | 5,312,309 | 31.7% |
[ 81.5% - 82.0% ] 81.77% | 5,620,110 | 30.3% |
[ 82.0% - 82.5% ] 82.25% | 4,520,384 | 31.1% |
[ 82.5% - 83.0% ] 82.75% | 5,006,650 | 30.8% |
[ 83.0% - 83.5% ] 83.25% | 5,087,968 | 32.1% |
[ 83.5% - 84.0% ] 83.75% | 5,370,980 | 31.6% |
[ 84.0% - 84.5% ] 84.25% | 4,675,760 | 32.3% |
[ 84.5% - 85.0% ] 84.75% | 4,997,317 | 32.4% |
[ 85.0% - 85.5% ] 85.23% | 5,759,541 | 31.9% |
[ 85.5% - 86.0% ] 85.76% | 5,112,442 | 31.5% |
[ 86.0% - 86.5% ] 86.25% | 4,844,818 | 30.7% |
[ 86.5% - 87.0% ] 86.74% | 5,378,314 | 32.7% |
[ 87.0% - 87.5% ] 87.26% | 5,271,698 | 30.9% |
[ 87.5% - 88.0% ] 87.75% | 5,255,256 | 33.6% |
[ 88.0% - 88.5% ] 88.26% | 5,514,116 | 32.6% |
[ 88.5% - 89.0% ] 88.75% | 5,331,624 | 32.7% |
[ 89.0% - 89.5% ] 89.25% | 4,678,451 | 32.8% |
[ 89.5% - 90.0% ] 89.74% | 4,512,740 | 33.6% |
[ 90.0% - 90.5% ] 90.25% | 4,279,723 | 32.5% |
[ 90.5% - 91.0% ] 90.76% | 5,173,505 | 31.8% |
[ 91.0% - 91.5% ] 91.25% | 5,590,269 | 33.5% |
[ 91.5% - 92.0% ] 91.75% | 4,452,717 | 31.8% |
[ 92.0% - 92.5% ] 92.25% | 5,218,114 | 31.9% |
[ 92.5% - 93.0% ] 92.75% | 4,828,967 | 31.3% |
[ 93.0% - 93.5% ] 93.24% | 4,710,233 | 31.5% |
[ 93.5% - 94.0% ] 93.75% | 4,208,742 | 31.9% |
[ 94.0% - 94.5% ] 94.26% | 4,438,273 | 32.3% |
[ 94.5% - 95.0% ] 94.75% | 4,410,866 | 31.7% |
[ 95.0% - 95.5% ] 95.26% | 3,731,373 | 32.5% |
[ 95.5% - 96.0% ] 95.76% | 3,361,134 | 31.7% |
[ 96.0% - 96.5% ] 96.25% | 2,960,951 | 31.6% |
[ 96.5% - 97.0% ] 96.75% | 2,608,500 | 32.6% |
[ 97.0% - 97.5% ] 97.25% | 2,223,524 | 31.8% |
[ 97.5% - 98.0% ] 97.74% | 1,968,969 | 33.8% |
[ 98.0% - 98.5% ] 98.25% | 1,422,558 | 33.6% |
[ 98.5% - 99.0% ] 98.73% | 1,085,208 | 33.1% |
[ 99.0% - 99.5% ] 99.24% | 637,755 | 32.4% |
[ 99.5% - 100.0% ] 99.89% | 1,000,228 | 37.4% |