Pennsylvania German Wage/Income Gap
COMPARE
Pennsylvania German
Select to Compare
Wage/Income Gap
Pennsylvania German Wage/Income Gap
30.7%
WAGE/INCOME GAP
0.0/ 100
METRIC RATING
342nd/ 347
METRIC RANK
Pennsylvania German Wage/Income Gap Correlation Chart
The statistical analysis conducted on geographies consisting of 233,865,703 people shows a poor positive correlation between the proportion of Pennsylvania Germans and wage/income gap percentage in the United States with a correlation coefficient (R) of 0.161 and weighted average of 30.7%. On average, for every 1% (one percent) increase in Pennsylvania Germans within a typical geography, there is an increase of 0.21% in wage/income gap percentage.
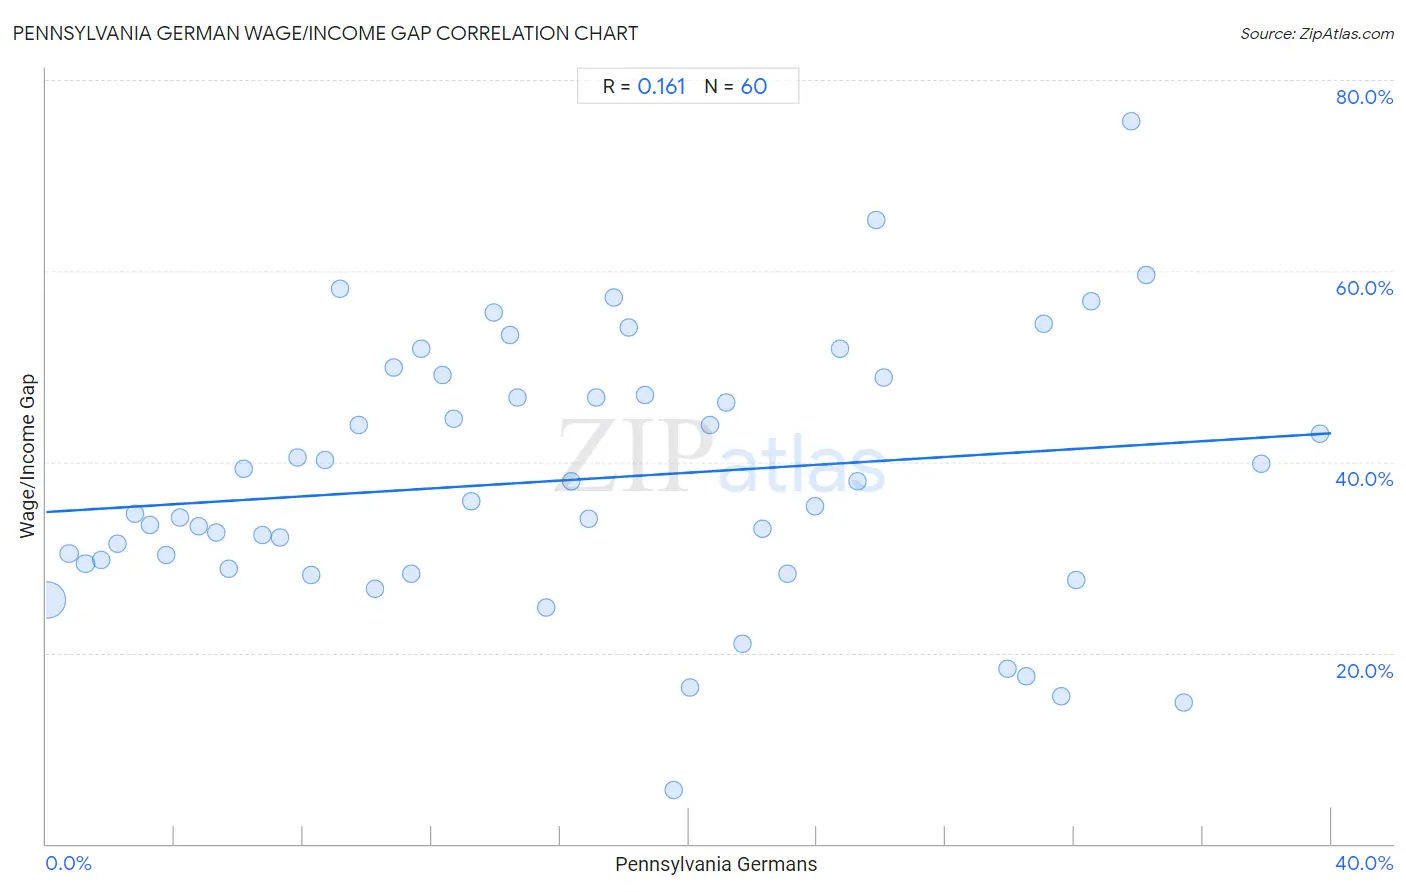
It is essential to understand that the correlation between the percentage of Pennsylvania Germans and wage/income gap percentage does not imply a direct cause-and-effect relationship. It remains uncertain whether the presence of Pennsylvania Germans influences an upward or downward trend in the level of wage/income gap percentage within an area, or if Pennsylvania Germans simply ended up residing in those areas with higher or lower levels of wage/income gap percentage due to other factors.
Demographics Similar to Pennsylvania Germans by Wage/Income Gap
In terms of wage/income gap, the demographic groups most similar to Pennsylvania Germans are Thai (30.5%, a difference of 0.77%), Danish (31.0%, a difference of 0.84%), Assyrian/Chaldean/Syriac (31.0%, a difference of 0.97%), Swiss (30.0%, a difference of 2.5%), and Immigrants from India (31.5%, a difference of 2.7%).
| Demographics | Rating | Rank | Wage/Income Gap |
| Europeans | 0.0 /100 | #333 | Tragic 29.4% |
| Swedes | 0.0 /100 | #334 | Tragic 29.4% |
| Immigrants from Taiwan | 0.0 /100 | #335 | Tragic 29.5% |
| English | 0.0 /100 | #336 | Tragic 29.5% |
| Dutch | 0.0 /100 | #337 | Tragic 29.6% |
| Filipinos | 0.0 /100 | #338 | Tragic 29.7% |
| Iranians | 0.0 /100 | #339 | Tragic 29.7% |
| Swiss | 0.0 /100 | #340 | Tragic 30.0% |
| Thais | 0.0 /100 | #341 | Tragic 30.5% |
| Pennsylvania Germans | 0.0 /100 | #342 | Tragic 30.7% |
| Danes | 0.0 /100 | #343 | Tragic 31.0% |
| Assyrians/Chaldeans/Syriacs | 0.0 /100 | #344 | Tragic 31.0% |
| Immigrants from India | 0.0 /100 | #345 | Tragic 31.5% |
| Cajuns | 0.0 /100 | #346 | Tragic 33.9% |
| Houma | 0.0 /100 | #347 | Tragic 38.7% |
Pennsylvania German Wage/Income Gap Correlation Summary
| Measurement | Pennsylvania German Data | Wage/Income Gap Data |
| Minimum | 0.058% | 5.6% |
| Maximum | 39.7% | 75.6% |
| Range | 39.6% | 70.1% |
| Mean | 16.5% | 38.1% |
| Median | 15.1% | 35.6% |
| Interquartile 25% (IQ1) | 7.5% | 29.1% |
| Interquartile 75% (IQ3) | 24.3% | 48.0% |
| Interquartile Range (IQR) | 16.8% | 18.9% |
| Standard Deviation (Sample) | 10.8% | 13.8% |
| Standard Deviation (Population) | 10.7% | 13.6% |
Correlation Details
| Pennsylvania German Percentile | Sample Size | Wage/Income Gap |
[ 0.0% - 0.5% ] 0.058% | 222,088,041 | 25.5% |
[ 0.5% - 1.0% ] 0.72% | 5,448,900 | 30.4% |
[ 1.0% - 1.5% ] 1.23% | 2,078,461 | 29.4% |
[ 1.5% - 2.0% ] 1.72% | 1,360,994 | 29.7% |
[ 2.0% - 2.5% ] 2.22% | 661,431 | 31.4% |
[ 2.5% - 3.0% ] 2.77% | 481,792 | 34.6% |
[ 3.0% - 3.5% ] 3.23% | 353,941 | 33.3% |
[ 3.5% - 4.0% ] 3.73% | 233,063 | 30.3% |
[ 4.0% - 4.5% ] 4.15% | 265,999 | 34.2% |
[ 4.5% - 5.0% ] 4.75% | 172,717 | 33.2% |
[ 5.0% - 5.5% ] 5.28% | 111,799 | 32.6% |
[ 5.5% - 6.0% ] 5.67% | 81,822 | 28.8% |
[ 6.0% - 6.5% ] 6.14% | 57,467 | 39.2% |
[ 6.5% - 7.0% ] 6.75% | 97,461 | 32.3% |
[ 7.0% - 7.5% ] 7.27% | 24,027 | 32.1% |
[ 7.5% - 8.0% ] 7.82% | 21,881 | 40.5% |
[ 8.0% - 8.5% ] 8.26% | 49,692 | 28.1% |
[ 8.5% - 9.0% ] 8.66% | 38,734 | 40.1% |
[ 9.0% - 9.5% ] 9.14% | 14,872 | 58.1% |
[ 9.5% - 10.0% ] 9.72% | 16,937 | 43.9% |
[ 10.0% - 10.5% ] 10.25% | 24,755 | 26.7% |
[ 10.5% - 11.0% ] 10.81% | 34,503 | 49.9% |
[ 11.0% - 11.5% ] 11.37% | 4,053 | 28.3% |
[ 11.5% - 12.0% ] 11.68% | 22,727 | 51.9% |
[ 12.0% - 12.5% ] 12.35% | 17,266 | 49.1% |
[ 12.5% - 13.0% ] 12.69% | 2,136 | 44.6% |
[ 13.0% - 13.5% ] 13.23% | 11,382 | 35.9% |
[ 13.5% - 14.0% ] 13.95% | 803 | 55.6% |
[ 14.0% - 14.5% ] 14.44% | 4,334 | 53.3% |
[ 14.5% - 15.0% ] 14.68% | 6,594 | 46.8% |
[ 15.5% - 16.0% ] 15.58% | 1,014 | 24.8% |
[ 16.0% - 16.5% ] 16.34% | 2,087 | 38.0% |
[ 16.5% - 17.0% ] 16.89% | 11,136 | 34.1% |
[ 17.0% - 17.5% ] 17.13% | 3,421 | 46.7% |
[ 17.5% - 18.0% ] 17.65% | 663 | 57.2% |
[ 18.0% - 18.5% ] 18.13% | 6,917 | 54.0% |
[ 18.5% - 19.0% ] 18.65% | 906 | 47.1% |
[ 19.5% - 20.0% ] 19.54% | 1,034 | 5.6% |
[ 20.0% - 20.5% ] 20.04% | 1,622 | 16.4% |
[ 20.5% - 21.0% ] 20.66% | 847 | 43.9% |
[ 21.0% - 21.5% ] 21.17% | 392 | 46.2% |
[ 21.5% - 22.0% ] 21.69% | 4,699 | 21.0% |
[ 22.0% - 22.5% ] 22.31% | 4,576 | 33.0% |
[ 23.0% - 23.5% ] 23.06% | 2,090 | 28.2% |
[ 23.5% - 24.0% ] 23.92% | 1,522 | 35.4% |
[ 24.5% - 25.0% ] 24.71% | 3,419 | 51.9% |
[ 25.0% - 25.5% ] 25.24% | 5,376 | 37.9% |
[ 25.5% - 26.0% ] 25.83% | 302 | 65.4% |
[ 26.0% - 26.5% ] 26.07% | 560 | 48.9% |
[ 29.5% - 30.0% ] 29.92% | 1,514 | 18.4% |
[ 30.5% - 31.0% ] 30.50% | 318 | 17.6% |
[ 31.0% - 31.5% ] 31.04% | 1,034 | 54.5% |
[ 31.5% - 32.0% ] 31.58% | 57 | 15.4% |
[ 32.0% - 32.5% ] 32.06% | 499 | 27.7% |
[ 32.5% - 33.0% ] 32.54% | 16,090 | 56.8% |
[ 33.5% - 34.0% ] 33.78% | 370 | 75.6% |
[ 34.0% - 34.5% ] 34.24% | 2,030 | 59.6% |
[ 35.0% - 35.5% ] 35.42% | 96 | 14.8% |
[ 37.5% - 38.0% ] 37.82% | 238 | 39.8% |
[ 39.5% - 40.0% ] 39.65% | 2,290 | 42.9% |