South American Wage/Income Gap
COMPARE
South American
Select to Compare
Wage/Income Gap
South American Wage/Income Gap
25.0%
WAGE/INCOME GAP
85.2/ 100
METRIC RATING
146th/ 347
METRIC RANK
South American Wage/Income Gap Correlation Chart
The statistical analysis conducted on geographies consisting of 493,539,614 people shows a mild positive correlation between the proportion of South Americans and wage/income gap percentage in the United States with a correlation coefficient (R) of 0.400 and weighted average of 25.0%. On average, for every 1% (one percent) increase in South Americans within a typical geography, there is an increase of 0.34% in wage/income gap percentage.
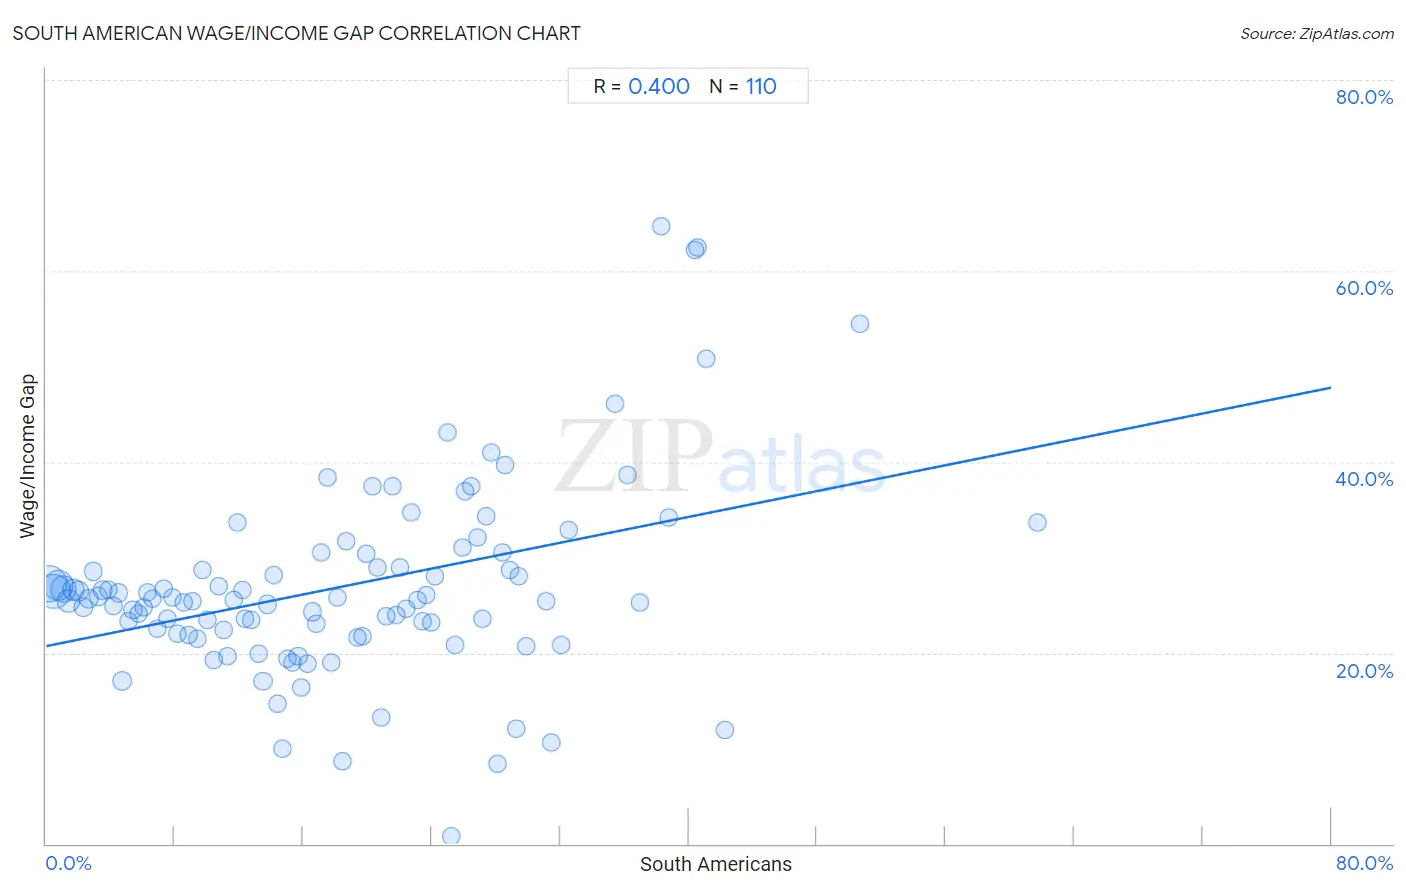
It is essential to understand that the correlation between the percentage of South Americans and wage/income gap percentage does not imply a direct cause-and-effect relationship. It remains uncertain whether the presence of South Americans influences an upward or downward trend in the level of wage/income gap percentage within an area, or if South Americans simply ended up residing in those areas with higher or lower levels of wage/income gap percentage due to other factors.
Demographics Similar to South Americans by Wage/Income Gap
In terms of wage/income gap, the demographic groups most similar to South Americans are Comanche (25.0%, a difference of 0.0%), Malaysian (25.0%, a difference of 0.030%), Iroquois (25.1%, a difference of 0.16%), Chippewa (25.0%, a difference of 0.24%), and Immigrants from Peru (25.1%, a difference of 0.31%).
| Demographics | Rating | Rank | Wage/Income Gap |
| Hispanics or Latinos | 89.5 /100 | #139 | Excellent 24.9% |
| Immigrants from Nepal | 89.3 /100 | #140 | Excellent 24.9% |
| Hawaiians | 89.3 /100 | #141 | Excellent 24.9% |
| Afghans | 88.1 /100 | #142 | Excellent 24.9% |
| Immigrants from Uganda | 88.0 /100 | #143 | Excellent 24.9% |
| Chippewa | 86.9 /100 | #144 | Excellent 25.0% |
| Comanche | 85.2 /100 | #145 | Excellent 25.0% |
| South Americans | 85.2 /100 | #146 | Excellent 25.0% |
| Malaysians | 84.9 /100 | #147 | Excellent 25.0% |
| Iroquois | 83.9 /100 | #148 | Excellent 25.1% |
| Immigrants from Peru | 82.6 /100 | #149 | Excellent 25.1% |
| Immigrants | 82.3 /100 | #150 | Excellent 25.1% |
| Taiwanese | 81.6 /100 | #151 | Excellent 25.1% |
| Uruguayans | 81.3 /100 | #152 | Excellent 25.2% |
| Blackfeet | 78.1 /100 | #153 | Good 25.2% |
South American Wage/Income Gap Correlation Summary
| Measurement | South American Data | Wage/Income Gap Data |
| Minimum | 0.16% | 0.78% |
| Maximum | 61.7% | 64.7% |
| Range | 61.6% | 63.9% |
| Mean | 18.2% | 26.9% |
| Median | 17.0% | 25.5% |
| Interquartile 25% (IQ1) | 8.5% | 22.0% |
| Interquartile 75% (IQ3) | 26.1% | 29.0% |
| Interquartile Range (IQR) | 17.5% | 7.0% |
| Standard Deviation (Sample) | 12.0% | 10.2% |
| Standard Deviation (Population) | 12.0% | 10.1% |
Correlation Details
| South American Percentile | Sample Size | Wage/Income Gap |
[ 0.0% - 0.5% ] 0.16% | 114,366,445 | 27.2% |
[ 0.0% - 0.5% ] 0.46% | 97,194,885 | 26.4% |
[ 0.5% - 1.0% ] 0.76% | 72,356,371 | 27.0% |
[ 1.0% - 1.5% ] 1.08% | 49,601,548 | 26.7% |
[ 1.0% - 1.5% ] 1.39% | 34,095,277 | 25.5% |
[ 1.5% - 2.0% ] 1.70% | 26,214,221 | 26.6% |
[ 2.0% - 2.5% ] 2.01% | 16,240,400 | 26.4% |
[ 2.0% - 2.5% ] 2.30% | 11,521,766 | 24.8% |
[ 2.5% - 3.0% ] 2.62% | 7,265,667 | 25.7% |
[ 2.5% - 3.0% ] 2.94% | 6,033,534 | 28.5% |
[ 3.0% - 3.5% ] 3.24% | 4,659,373 | 25.9% |
[ 3.5% - 4.0% ] 3.54% | 5,181,856 | 26.6% |
[ 3.5% - 4.0% ] 3.87% | 3,825,515 | 26.6% |
[ 4.0% - 4.5% ] 4.18% | 2,932,602 | 24.9% |
[ 4.0% - 4.5% ] 4.49% | 2,482,514 | 26.3% |
[ 4.5% - 5.0% ] 4.75% | 11,223,344 | 17.1% |
[ 5.0% - 5.5% ] 5.12% | 2,532,504 | 23.3% |
[ 5.0% - 5.5% ] 5.39% | 1,735,004 | 24.5% |
[ 5.5% - 6.0% ] 5.72% | 1,895,062 | 24.1% |
[ 6.0% - 6.5% ] 6.03% | 1,514,627 | 24.8% |
[ 6.0% - 6.5% ] 6.32% | 1,137,682 | 26.4% |
[ 6.5% - 7.0% ] 6.63% | 904,562 | 25.7% |
[ 6.5% - 7.0% ] 6.93% | 1,423,590 | 22.6% |
[ 7.0% - 7.5% ] 7.29% | 716,057 | 26.7% |
[ 7.5% - 8.0% ] 7.56% | 850,922 | 23.6% |
[ 7.5% - 8.0% ] 7.87% | 609,744 | 25.9% |
[ 8.0% - 8.5% ] 8.17% | 728,642 | 22.0% |
[ 8.5% - 9.0% ] 8.53% | 774,087 | 25.3% |
[ 8.5% - 9.0% ] 8.85% | 459,449 | 21.9% |
[ 9.0% - 9.5% ] 9.12% | 547,660 | 25.4% |
[ 9.0% - 9.5% ] 9.43% | 765,321 | 21.5% |
[ 9.5% - 10.0% ] 9.71% | 334,092 | 28.7% |
[ 10.0% - 10.5% ] 10.03% | 521,268 | 23.4% |
[ 10.0% - 10.5% ] 10.40% | 317,834 | 19.2% |
[ 10.5% - 11.0% ] 10.71% | 353,797 | 27.0% |
[ 11.0% - 11.5% ] 11.07% | 750,867 | 22.4% |
[ 11.0% - 11.5% ] 11.29% | 201,050 | 19.6% |
[ 11.5% - 12.0% ] 11.63% | 348,235 | 25.5% |
[ 11.5% - 12.0% ] 11.89% | 690,878 | 33.6% |
[ 12.0% - 12.5% ] 12.19% | 156,662 | 26.6% |
[ 12.0% - 12.5% ] 12.41% | 280,842 | 23.6% |
[ 12.5% - 13.0% ] 12.76% | 806,726 | 23.4% |
[ 13.0% - 13.5% ] 13.20% | 404,477 | 19.9% |
[ 13.5% - 14.0% ] 13.50% | 191,017 | 17.0% |
[ 13.5% - 14.0% ] 13.76% | 440,217 | 25.1% |
[ 14.0% - 14.5% ] 14.14% | 324,276 | 28.1% |
[ 14.0% - 14.5% ] 14.42% | 218,092 | 14.7% |
[ 14.5% - 15.0% ] 14.69% | 203,827 | 9.9% |
[ 14.5% - 15.0% ] 14.99% | 233,981 | 19.4% |
[ 15.0% - 15.5% ] 15.33% | 406,119 | 19.0% |
[ 15.5% - 16.0% ] 15.68% | 266,981 | 19.7% |
[ 15.5% - 16.0% ] 15.89% | 187,486 | 16.4% |
[ 16.0% - 16.5% ] 16.26% | 312,081 | 18.8% |
[ 16.5% - 17.0% ] 16.54% | 242,654 | 24.3% |
[ 16.5% - 17.0% ] 16.83% | 150,168 | 23.0% |
[ 17.0% - 17.5% ] 17.14% | 87,912 | 30.5% |
[ 17.5% - 18.0% ] 17.51% | 20,378 | 38.4% |
[ 17.5% - 18.0% ] 17.77% | 240,164 | 19.0% |
[ 18.0% - 18.5% ] 18.10% | 85,976 | 25.8% |
[ 18.0% - 18.5% ] 18.44% | 87,879 | 8.6% |
[ 18.5% - 19.0% ] 18.69% | 40,999 | 31.7% |
[ 19.0% - 19.5% ] 19.39% | 111,443 | 21.7% |
[ 19.5% - 20.0% ] 19.70% | 85,749 | 21.7% |
[ 19.5% - 20.0% ] 19.96% | 147,015 | 30.4% |
[ 20.0% - 20.5% ] 20.33% | 19,895 | 37.5% |
[ 20.5% - 21.0% ] 20.60% | 71,060 | 28.9% |
[ 20.5% - 21.0% ] 20.84% | 158,259 | 13.2% |
[ 21.0% - 21.5% ] 21.17% | 109,891 | 23.9% |
[ 21.5% - 22.0% ] 21.54% | 31,140 | 37.4% |
[ 21.5% - 22.0% ] 21.81% | 240,443 | 24.0% |
[ 22.0% - 22.5% ] 22.03% | 56,751 | 29.0% |
[ 22.0% - 22.5% ] 22.41% | 104,631 | 24.6% |
[ 22.5% - 23.0% ] 22.72% | 10,396 | 34.6% |
[ 23.0% - 23.5% ] 23.10% | 64,260 | 25.6% |
[ 23.0% - 23.5% ] 23.39% | 174,733 | 23.2% |
[ 23.5% - 24.0% ] 23.68% | 230,389 | 26.0% |
[ 23.5% - 24.0% ] 23.96% | 59,843 | 23.2% |
[ 24.0% - 24.5% ] 24.18% | 8,718 | 28.0% |
[ 24.5% - 25.0% ] 24.95% | 20,760 | 43.1% |
[ 25.0% - 25.5% ] 25.23% | 5,164 | 0.78% |
[ 25.0% - 25.5% ] 25.42% | 101,739 | 20.8% |
[ 25.5% - 26.0% ] 25.90% | 35,967 | 31.1% |
[ 26.0% - 26.5% ] 26.05% | 56,757 | 37.0% |
[ 26.0% - 26.5% ] 26.50% | 21,935 | 37.4% |
[ 26.5% - 27.0% ] 26.89% | 89,647 | 32.1% |
[ 27.0% - 27.5% ] 27.16% | 42,956 | 23.6% |
[ 27.0% - 27.5% ] 27.42% | 44,878 | 34.3% |
[ 27.5% - 28.0% ] 27.69% | 89,577 | 41.0% |
[ 28.0% - 28.5% ] 28.08% | 67,001 | 8.3% |
[ 28.0% - 28.5% ] 28.38% | 303 | 30.5% |
[ 28.5% - 29.0% ] 28.57% | 20,971 | 39.6% |
[ 28.5% - 29.0% ] 28.90% | 79,308 | 28.6% |
[ 29.0% - 29.5% ] 29.27% | 26,364 | 12.1% |
[ 29.0% - 29.5% ] 29.41% | 22,540 | 28.1% |
[ 29.5% - 30.0% ] 29.84% | 112,750 | 20.7% |
[ 31.0% - 31.5% ] 31.13% | 11,069 | 25.3% |
[ 31.0% - 31.5% ] 31.40% | 15,732 | 10.7% |
[ 32.0% - 32.5% ] 32.05% | 2,811 | 20.8% |
[ 32.5% - 33.0% ] 32.56% | 43 | 32.9% |
[ 35.0% - 35.5% ] 35.42% | 68,029 | 46.0% |
[ 36.0% - 36.5% ] 36.16% | 31,514 | 38.7% |
[ 36.5% - 37.0% ] 36.95% | 249 | 25.3% |
[ 38.0% - 38.5% ] 38.28% | 4,407 | 64.7% |
[ 38.5% - 39.0% ] 38.73% | 1,761 | 34.2% |
[ 40.0% - 40.5% ] 40.36% | 14,639 | 62.2% |
[ 40.5% - 41.0% ] 40.54% | 14,572 | 62.5% |
[ 41.0% - 41.5% ] 41.13% | 5,843 | 50.8% |
[ 42.0% - 42.5% ] 42.26% | 6,186 | 11.9% |
[ 50.5% - 51.0% ] 50.63% | 2,718 | 54.5% |
[ 61.5% - 62.0% ] 61.73% | 139,642 | 33.6% |