Immigrants from St. Vincent and the Grenadines Wage/Income Gap
COMPARE
Immigrants from St. Vincent and the Grenadines
Select to Compare
Wage/Income Gap
Immigrants from St. Vincent and the Grenadines Wage/Income Gap
16.4%
WAGE/INCOME GAP
100.0/ 100
METRIC RATING
2nd/ 347
METRIC RANK
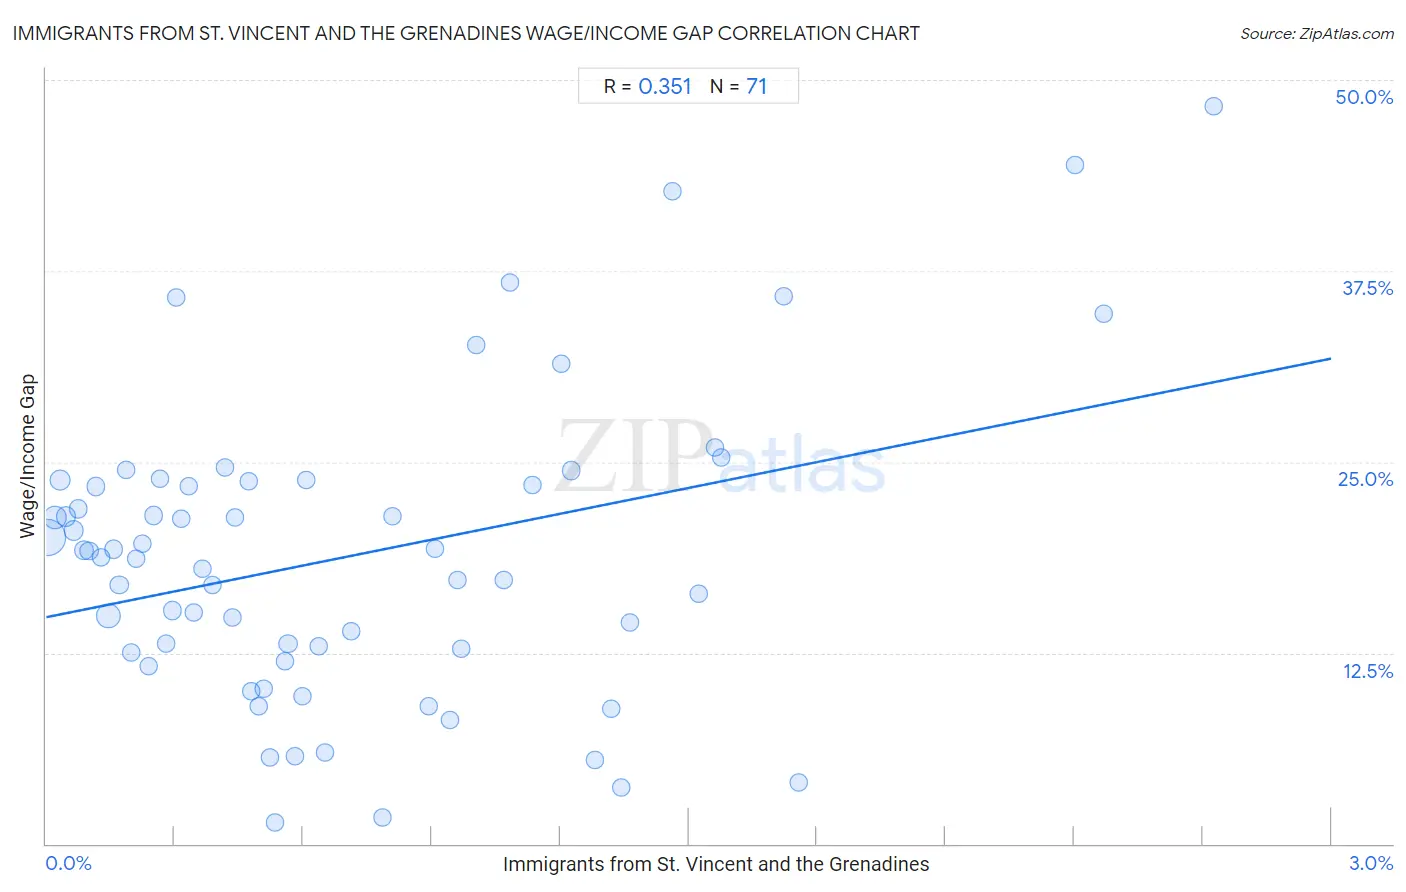
Immigrants from St. Vincent and the Grenadines Wage/Income Gap Correlation Chart
The statistical analysis conducted on geographies consisting of 56,186,231 people shows a mild positive correlation between the proportion of Immigrants from St. Vincent and the Grenadines and wage/income gap percentage in the United States with a correlation coefficient (R) of 0.351 and weighted average of 16.4%. On average, for every 1% (one percent) increase in Immigrants from St. Vincent and the Grenadines within a typical geography, there is an increase of 5.6% in wage/income gap percentage.
It is essential to understand that the correlation between the percentage of Immigrants from St. Vincent and the Grenadines and wage/income gap percentage does not imply a direct cause-and-effect relationship. It remains uncertain whether the presence of Immigrants from St. Vincent and the Grenadines influences an upward or downward trend in the level of wage/income gap percentage within an area, or if Immigrants from St. Vincent and the Grenadines simply ended up residing in those areas with higher or lower levels of wage/income gap percentage due to other factors.
Demographics Similar to Immigrants from St. Vincent and the Grenadines by Wage/Income Gap
In terms of wage/income gap, the demographic groups most similar to Immigrants from St. Vincent and the Grenadines are Immigrants from Grenada (16.2%, a difference of 1.5%), Immigrants from Barbados (17.8%, a difference of 8.6%), British West Indian (18.0%, a difference of 9.7%), Guyanese (18.3%, a difference of 11.5%), and Immigrants from Guyana (18.4%, a difference of 11.8%).
| Demographics | Rating | Rank | Wage/Income Gap |
| Immigrants from Grenada | 100.0 /100 | #1 | Exceptional 16.2% |
| Immigrants from St. Vincent and the Grenadines | 100.0 /100 | #2 | Exceptional 16.4% |
| Immigrants from Barbados | 100.0 /100 | #3 | Exceptional 17.8% |
| British West Indians | 100.0 /100 | #4 | Exceptional 18.0% |
| Guyanese | 100.0 /100 | #5 | Exceptional 18.3% |
| Immigrants from Guyana | 100.0 /100 | #6 | Exceptional 18.4% |
| Puerto Ricans | 100.0 /100 | #7 | Exceptional 18.7% |
| Immigrants from Jamaica | 100.0 /100 | #8 | Exceptional 18.8% |
| Barbadians | 100.0 /100 | #9 | Exceptional 19.0% |
| Crow | 100.0 /100 | #10 | Exceptional 19.1% |
| Immigrants from Haiti | 100.0 /100 | #11 | Exceptional 19.2% |
| Immigrants from West Indies | 100.0 /100 | #12 | Exceptional 19.2% |
| Trinidadians and Tobagonians | 100.0 /100 | #13 | Exceptional 19.3% |
| Immigrants from Trinidad and Tobago | 100.0 /100 | #14 | Exceptional 19.3% |
| West Indians | 100.0 /100 | #15 | Exceptional 19.6% |
Immigrants from St. Vincent and the Grenadines Wage/Income Gap Correlation Summary
| Measurement | Immigrants from St. Vincent and the Grenadines Data | Wage/Income Gap Data |
| Minimum | 0.0039% | 1.4% |
| Maximum | 2.7% | 48.3% |
| Range | 2.7% | 46.9% |
| Mean | 0.70% | 18.8% |
| Median | 0.52% | 18.8% |
| Interquartile 25% (IQ1) | 0.24% | 12.5% |
| Interquartile 75% (IQ3) | 1.1% | 23.7% |
| Interquartile Range (IQR) | 0.83% | 11.2% |
| Standard Deviation (Sample) | 0.61% | 9.8% |
| Standard Deviation (Population) | 0.61% | 9.8% |
Correlation Details
| Immigrants from St. Vincent and the Grenadines Percentile | Sample Size | Wage/Income Gap |
[ 0.0% - 0.5% ] 0.0039% | 24,566,815 | 20.0% |
[ 0.0% - 0.5% ] 0.021% | 6,578,819 | 21.4% |
[ 0.0% - 0.5% ] 0.033% | 3,089,661 | 23.8% |
[ 0.0% - 0.5% ] 0.047% | 2,410,454 | 21.4% |
[ 0.0% - 0.5% ] 0.063% | 1,939,034 | 20.5% |
[ 0.0% - 0.5% ] 0.075% | 1,333,192 | 21.9% |
[ 0.0% - 0.5% ] 0.088% | 940,338 | 19.2% |
[ 0.0% - 0.5% ] 0.10% | 712,806 | 19.2% |
[ 0.0% - 0.5% ] 0.12% | 942,256 | 23.4% |
[ 0.0% - 0.5% ] 0.13% | 347,845 | 18.8% |
[ 0.0% - 0.5% ] 0.15% | 9,141,069 | 14.9% |
[ 0.0% - 0.5% ] 0.16% | 302,458 | 19.3% |
[ 0.0% - 0.5% ] 0.17% | 265,401 | 17.0% |
[ 0.0% - 0.5% ] 0.19% | 313,272 | 24.5% |
[ 0.0% - 0.5% ] 0.20% | 65,617 | 12.5% |
[ 0.0% - 0.5% ] 0.21% | 206,375 | 18.7% |
[ 0.0% - 0.5% ] 0.22% | 196,121 | 19.6% |
[ 0.0% - 0.5% ] 0.24% | 212,920 | 11.6% |
[ 0.0% - 0.5% ] 0.25% | 364,707 | 21.5% |
[ 0.0% - 0.5% ] 0.26% | 24,582 | 23.9% |
[ 0.0% - 0.5% ] 0.28% | 349,512 | 13.1% |
[ 0.0% - 0.5% ] 0.29% | 237,591 | 15.3% |
[ 0.0% - 0.5% ] 0.30% | 2,975 | 35.7% |
[ 0.0% - 0.5% ] 0.32% | 54,109 | 21.3% |
[ 0.0% - 0.5% ] 0.33% | 68,009 | 23.4% |
[ 0.0% - 0.5% ] 0.35% | 15,356 | 15.1% |
[ 0.0% - 0.5% ] 0.36% | 30,268 | 18.0% |
[ 0.0% - 0.5% ] 0.39% | 8,732 | 16.9% |
[ 0.0% - 0.5% ] 0.42% | 69,734 | 24.7% |
[ 0.0% - 0.5% ] 0.43% | 60,268 | 14.8% |
[ 0.0% - 0.5% ] 0.44% | 70,920 | 21.4% |
[ 0.0% - 0.5% ] 0.47% | 1,696 | 23.7% |
[ 0.0% - 0.5% ] 0.48% | 25,039 | 10.0% |
[ 0.0% - 0.5% ] 0.49% | 57,001 | 9.0% |
[ 0.5% - 1.0% ] 0.51% | 3,548 | 10.2% |
[ 0.5% - 1.0% ] 0.52% | 103,677 | 5.7% |
[ 0.5% - 1.0% ] 0.53% | 4,502 | 1.4% |
[ 0.5% - 1.0% ] 0.56% | 65,310 | 12.0% |
[ 0.5% - 1.0% ] 0.56% | 135,666 | 13.1% |
[ 0.5% - 1.0% ] 0.58% | 89,976 | 5.7% |
[ 0.5% - 1.0% ] 0.60% | 63,426 | 9.7% |
[ 0.5% - 1.0% ] 0.61% | 11,041 | 23.8% |
[ 0.5% - 1.0% ] 0.64% | 27,808 | 12.9% |
[ 0.5% - 1.0% ] 0.65% | 7,993 | 6.0% |
[ 0.5% - 1.0% ] 0.71% | 5,897 | 13.9% |
[ 0.5% - 1.0% ] 0.78% | 13,261 | 1.7% |
[ 0.5% - 1.0% ] 0.81% | 10,526 | 21.4% |
[ 0.5% - 1.0% ] 0.89% | 15,001 | 9.0% |
[ 0.5% - 1.0% ] 0.91% | 13,455 | 19.3% |
[ 0.5% - 1.0% ] 0.94% | 62,373 | 8.1% |
[ 0.5% - 1.0% ] 0.96% | 1,146 | 17.3% |
[ 0.5% - 1.0% ] 0.97% | 6,198 | 12.8% |
[ 1.0% - 1.5% ] 1.00% | 9,863 | 32.7% |
[ 1.0% - 1.5% ] 1.07% | 15,245 | 17.3% |
[ 1.0% - 1.5% ] 1.08% | 4,065 | 36.8% |
[ 1.0% - 1.5% ] 1.14% | 528 | 23.5% |
[ 1.0% - 1.5% ] 1.20% | 10,976 | 31.4% |
[ 1.0% - 1.5% ] 1.23% | 84,006 | 24.4% |
[ 1.0% - 1.5% ] 1.28% | 100,082 | 5.5% |
[ 1.0% - 1.5% ] 1.32% | 32,296 | 8.8% |
[ 1.0% - 1.5% ] 1.34% | 298 | 3.7% |
[ 1.0% - 1.5% ] 1.36% | 96,801 | 14.5% |
[ 1.0% - 1.5% ] 1.46% | 1,640 | 42.7% |
[ 1.5% - 2.0% ] 1.52% | 69,131 | 16.4% |
[ 1.5% - 2.0% ] 1.56% | 4,418 | 26.0% |
[ 1.5% - 2.0% ] 1.58% | 16,808 | 25.3% |
[ 1.5% - 2.0% ] 1.72% | 4,240 | 35.8% |
[ 1.5% - 2.0% ] 1.76% | 78,506 | 4.0% |
[ 2.0% - 2.5% ] 2.40% | 5,202 | 44.4% |
[ 2.0% - 2.5% ] 2.47% | 1,782 | 34.7% |
[ 2.5% - 3.0% ] 2.72% | 4,588 | 48.3% |