Immigrants from Belarus Wage/Income Gap
COMPARE
Immigrants from Belarus
Select to Compare
Wage/Income Gap
Immigrants from Belarus Wage/Income Gap
25.7%
WAGE/INCOME GAP
52.9/ 100
METRIC RATING
173rd/ 347
METRIC RANK
Immigrants from Belarus Wage/Income Gap Correlation Chart
The statistical analysis conducted on geographies consisting of 150,180,319 people shows a moderate positive correlation between the proportion of Immigrants from Belarus and wage/income gap percentage in the United States with a correlation coefficient (R) of 0.407 and weighted average of 25.7%. On average, for every 1% (one percent) increase in Immigrants from Belarus within a typical geography, there is an increase of 4.0% in wage/income gap percentage.
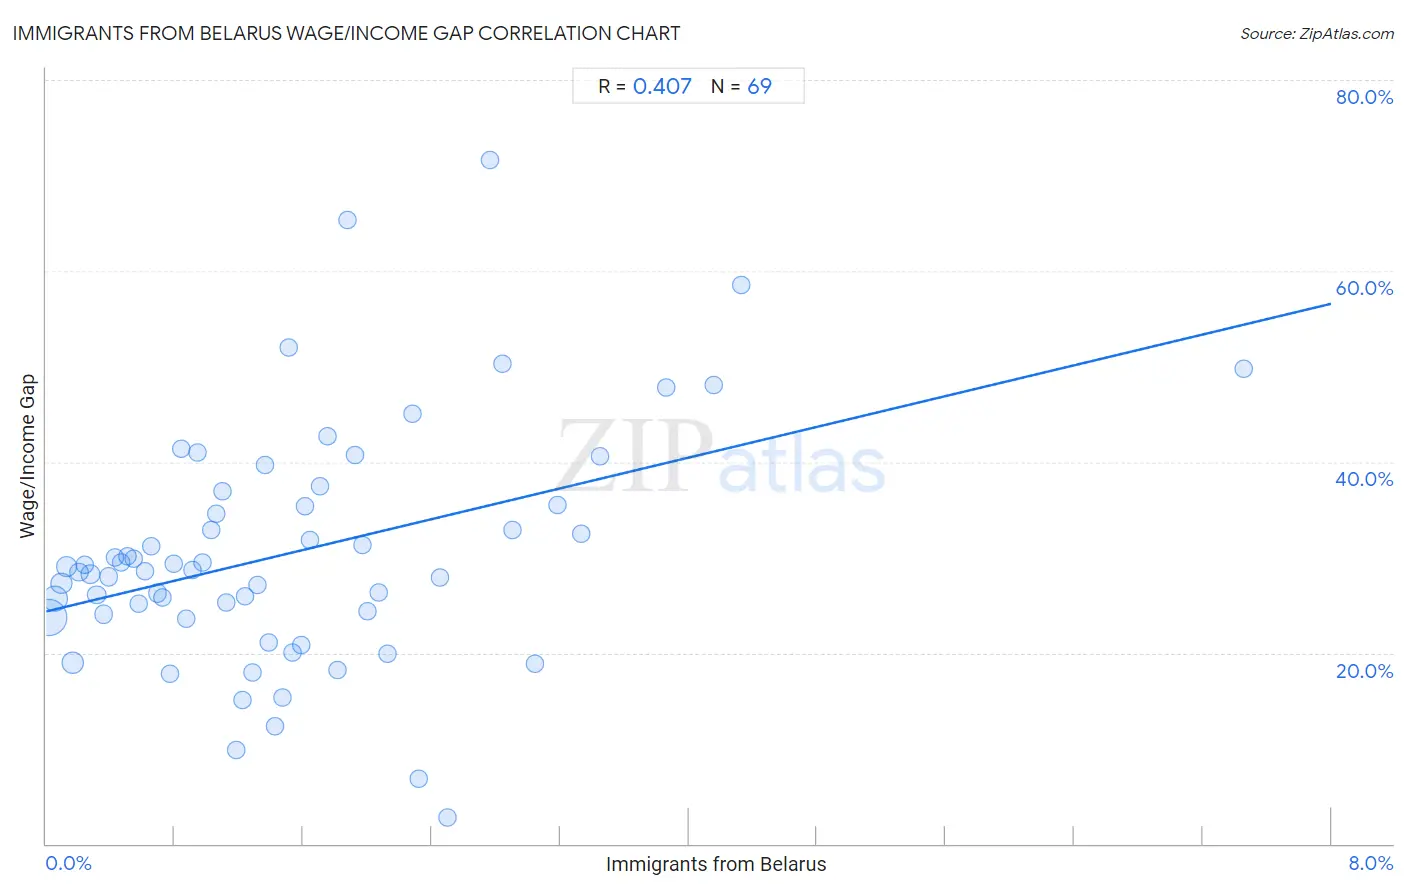
It is essential to understand that the correlation between the percentage of Immigrants from Belarus and wage/income gap percentage does not imply a direct cause-and-effect relationship. It remains uncertain whether the presence of Immigrants from Belarus influences an upward or downward trend in the level of wage/income gap percentage within an area, or if Immigrants from Belarus simply ended up residing in those areas with higher or lower levels of wage/income gap percentage due to other factors.
Demographics Similar to Immigrants from Belarus by Wage/Income Gap
In terms of wage/income gap, the demographic groups most similar to Immigrants from Belarus are Immigrants from Chile (25.7%, a difference of 0.020%), Alaskan Athabascan (25.8%, a difference of 0.19%), Immigrants from Greece (25.7%, a difference of 0.24%), Immigrants from Oceania (25.6%, a difference of 0.31%), and Sri Lankan (25.8%, a difference of 0.39%).
| Demographics | Rating | Rank | Wage/Income Gap |
| Immigrants from Ukraine | 63.8 /100 | #166 | Good 25.5% |
| Paiute | 62.9 /100 | #167 | Good 25.5% |
| Seminole | 62.6 /100 | #168 | Good 25.6% |
| Peruvians | 60.1 /100 | #169 | Good 25.6% |
| Immigrants from Oceania | 57.5 /100 | #170 | Average 25.6% |
| Immigrants from Greece | 56.6 /100 | #171 | Average 25.7% |
| Immigrants from Chile | 53.2 /100 | #172 | Average 25.7% |
| Immigrants from Belarus | 52.9 /100 | #173 | Average 25.7% |
| Alaskan Athabascans | 50.0 /100 | #174 | Average 25.8% |
| Sri Lankans | 47.0 /100 | #175 | Average 25.8% |
| Paraguayans | 46.7 /100 | #176 | Average 25.8% |
| Cambodians | 45.1 /100 | #177 | Average 25.8% |
| Chinese | 42.0 /100 | #178 | Average 25.9% |
| Samoans | 38.6 /100 | #179 | Fair 26.0% |
| Guamanians/Chamorros | 38.0 /100 | #180 | Fair 26.0% |
Immigrants from Belarus Wage/Income Gap Correlation Summary
| Measurement | Immigrants from Belarus Data | Wage/Income Gap Data |
| Minimum | 0.017% | 2.8% |
| Maximum | 7.5% | 71.7% |
| Range | 7.4% | 68.9% |
| Mean | 1.5% | 30.5% |
| Median | 1.3% | 28.7% |
| Interquartile 25% (IQ1) | 0.63% | 23.9% |
| Interquartile 75% (IQ3) | 2.0% | 36.2% |
| Interquartile Range (IQR) | 1.4% | 12.3% |
| Standard Deviation (Sample) | 1.3% | 12.5% |
| Standard Deviation (Population) | 1.3% | 12.4% |
Correlation Details
| Immigrants from Belarus Percentile | Sample Size | Wage/Income Gap |
[ 0.0% - 0.5% ] 0.017% | 73,543,198 | 23.7% |
[ 0.0% - 0.5% ] 0.051% | 30,036,735 | 25.6% |
[ 0.0% - 0.5% ] 0.092% | 13,092,806 | 27.3% |
[ 0.0% - 0.5% ] 0.13% | 7,150,093 | 29.0% |
[ 0.0% - 0.5% ] 0.17% | 12,800,286 | 18.9% |
[ 0.0% - 0.5% ] 0.20% | 2,669,456 | 28.4% |
[ 0.0% - 0.5% ] 0.24% | 1,905,571 | 29.2% |
[ 0.0% - 0.5% ] 0.28% | 1,564,193 | 28.2% |
[ 0.0% - 0.5% ] 0.31% | 1,290,729 | 26.1% |
[ 0.0% - 0.5% ] 0.36% | 881,639 | 24.0% |
[ 0.0% - 0.5% ] 0.39% | 694,450 | 28.0% |
[ 0.0% - 0.5% ] 0.43% | 480,249 | 30.0% |
[ 0.0% - 0.5% ] 0.46% | 590,199 | 29.5% |
[ 0.5% - 1.0% ] 0.50% | 293,044 | 30.1% |
[ 0.5% - 1.0% ] 0.54% | 429,011 | 29.8% |
[ 0.5% - 1.0% ] 0.58% | 246,233 | 25.1% |
[ 0.5% - 1.0% ] 0.61% | 188,782 | 28.5% |
[ 0.5% - 1.0% ] 0.65% | 68,620 | 31.2% |
[ 0.5% - 1.0% ] 0.69% | 168,226 | 26.3% |
[ 0.5% - 1.0% ] 0.72% | 277,118 | 25.8% |
[ 0.5% - 1.0% ] 0.77% | 38,863 | 17.8% |
[ 0.5% - 1.0% ] 0.79% | 116,556 | 29.3% |
[ 0.5% - 1.0% ] 0.84% | 37,752 | 41.3% |
[ 0.5% - 1.0% ] 0.87% | 110,930 | 23.6% |
[ 0.5% - 1.0% ] 0.91% | 96,125 | 28.7% |
[ 0.5% - 1.0% ] 0.94% | 64,930 | 41.0% |
[ 0.5% - 1.0% ] 0.98% | 106,421 | 29.4% |
[ 1.0% - 1.5% ] 1.03% | 47,330 | 32.8% |
[ 1.0% - 1.5% ] 1.06% | 35,302 | 34.5% |
[ 1.0% - 1.5% ] 1.09% | 102,293 | 36.9% |
[ 1.0% - 1.5% ] 1.12% | 16,808 | 25.3% |
[ 1.0% - 1.5% ] 1.18% | 8,356 | 9.8% |
[ 1.0% - 1.5% ] 1.22% | 12,200 | 15.1% |
[ 1.0% - 1.5% ] 1.23% | 40,324 | 26.0% |
[ 1.0% - 1.5% ] 1.29% | 86,628 | 17.9% |
[ 1.0% - 1.5% ] 1.31% | 205,243 | 27.1% |
[ 1.0% - 1.5% ] 1.36% | 32,491 | 39.6% |
[ 1.0% - 1.5% ] 1.39% | 77,576 | 21.0% |
[ 1.0% - 1.5% ] 1.43% | 6,174 | 12.3% |
[ 1.0% - 1.5% ] 1.47% | 4,621 | 15.3% |
[ 1.5% - 2.0% ] 1.51% | 4,575 | 52.0% |
[ 1.5% - 2.0% ] 1.54% | 41,127 | 20.0% |
[ 1.5% - 2.0% ] 1.59% | 131,728 | 20.9% |
[ 1.5% - 2.0% ] 1.61% | 6,575 | 35.4% |
[ 1.5% - 2.0% ] 1.65% | 80,113 | 31.8% |
[ 1.5% - 2.0% ] 1.71% | 4,689 | 37.5% |
[ 1.5% - 2.0% ] 1.75% | 23,676 | 42.7% |
[ 1.5% - 2.0% ] 1.81% | 2,039 | 18.2% |
[ 1.5% - 2.0% ] 1.87% | 1,121 | 65.3% |
[ 1.5% - 2.0% ] 1.93% | 88,776 | 40.7% |
[ 1.5% - 2.0% ] 1.97% | 11,513 | 31.3% |
[ 1.5% - 2.0% ] 2.00% | 2,552 | 24.4% |
[ 2.0% - 2.5% ] 2.07% | 2,074 | 26.4% |
[ 2.0% - 2.5% ] 2.13% | 1,975 | 19.9% |
[ 2.0% - 2.5% ] 2.28% | 2,498 | 45.1% |
[ 2.0% - 2.5% ] 2.32% | 1,379 | 6.9% |
[ 2.0% - 2.5% ] 2.45% | 1,224 | 27.9% |
[ 2.0% - 2.5% ] 2.50% | 47,893 | 2.8% |
[ 2.5% - 3.0% ] 2.77% | 3,074 | 71.7% |
[ 2.5% - 3.0% ] 2.84% | 8,162 | 50.3% |
[ 2.5% - 3.0% ] 2.91% | 585 | 32.9% |
[ 3.0% - 3.5% ] 3.04% | 83,233 | 18.8% |
[ 3.0% - 3.5% ] 3.18% | 628 | 35.5% |
[ 3.0% - 3.5% ] 3.33% | 5,518 | 32.5% |
[ 3.0% - 3.5% ] 3.45% | 1,074 | 40.6% |
[ 3.5% - 4.0% ] 3.86% | 984 | 47.9% |
[ 4.0% - 4.5% ] 4.15% | 289 | 48.0% |
[ 4.0% - 4.5% ] 4.33% | 2,933 | 58.5% |
[ 7.0% - 7.5% ] 7.46% | 751 | 49.8% |