Native/Alaskan Wage/Income Gap
COMPARE
Native/Alaskan
Select to Compare
Wage/Income Gap
Native/Alaskan Wage/Income Gap
24.6%
WAGE/INCOME GAP
94.6/ 100
METRIC RATING
123rd/ 347
METRIC RANK
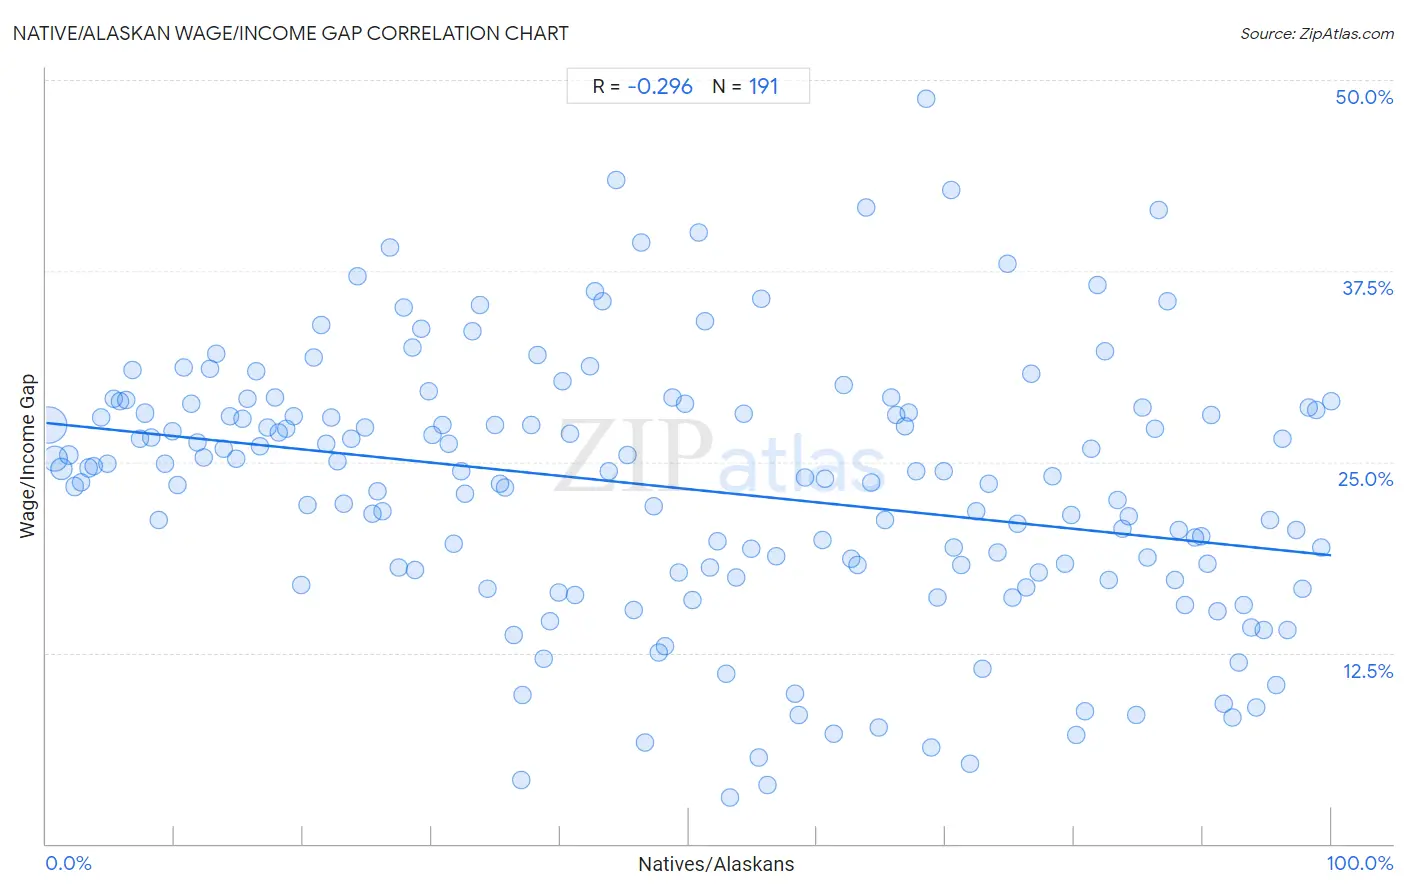
Native/Alaskan Wage/Income Gap Correlation Chart
The statistical analysis conducted on geographies consisting of 511,624,473 people shows a weak negative correlation between the proportion of Natives/Alaskans and wage/income gap percentage in the United States with a correlation coefficient (R) of -0.296 and weighted average of 24.6%. On average, for every 1% (one percent) increase in Natives/Alaskans within a typical geography, there is a decrease of 0.087% in wage/income gap percentage.
It is essential to understand that the correlation between the percentage of Natives/Alaskans and wage/income gap percentage does not imply a direct cause-and-effect relationship. It remains uncertain whether the presence of Natives/Alaskans influences an upward or downward trend in the level of wage/income gap percentage within an area, or if Natives/Alaskans simply ended up residing in those areas with higher or lower levels of wage/income gap percentage due to other factors.
Demographics Similar to Natives/Alaskans by Wage/Income Gap
In terms of wage/income gap, the demographic groups most similar to Natives/Alaskans are Apache (24.5%, a difference of 0.070%), Immigrants from Thailand (24.5%, a difference of 0.12%), Immigrants from South America (24.6%, a difference of 0.21%), Spanish American (24.6%, a difference of 0.23%), and Immigrants from Uruguay (24.6%, a difference of 0.25%).
| Demographics | Rating | Rank | Wage/Income Gap |
| Alaska Natives | 96.0 /100 | #116 | Exceptional 24.4% |
| Immigrants from Afghanistan | 95.9 /100 | #117 | Exceptional 24.4% |
| Immigrants from Micronesia | 95.8 /100 | #118 | Exceptional 24.4% |
| Kenyans | 95.8 /100 | #119 | Exceptional 24.5% |
| Cree | 95.6 /100 | #120 | Exceptional 24.5% |
| Immigrants from Thailand | 94.9 /100 | #121 | Exceptional 24.5% |
| Apache | 94.8 /100 | #122 | Exceptional 24.5% |
| Natives/Alaskans | 94.6 /100 | #123 | Exceptional 24.6% |
| Immigrants from South America | 93.9 /100 | #124 | Exceptional 24.6% |
| Spanish Americans | 93.8 /100 | #125 | Exceptional 24.6% |
| Immigrants from Uruguay | 93.8 /100 | #126 | Exceptional 24.6% |
| German Russians | 93.7 /100 | #127 | Exceptional 24.6% |
| Immigrants from Central America | 93.5 /100 | #128 | Exceptional 24.6% |
| Yup'ik | 93.3 /100 | #129 | Exceptional 24.7% |
| Alsatians | 93.2 /100 | #130 | Exceptional 24.7% |
Native/Alaskan Wage/Income Gap Correlation Summary
| Measurement | Native/Alaskan Data | Wage/Income Gap Data |
| Minimum | 0.21% | 3.1% |
| Maximum | 100.0% | 48.8% |
| Range | 99.8% | 45.7% |
| Mean | 49.5% | 23.3% |
| Median | 48.7% | 24.4% |
| Interquartile 25% (IQ1) | 23.7% | 17.8% |
| Interquartile 75% (IQ3) | 75.2% | 28.4% |
| Interquartile Range (IQR) | 51.5% | 10.6% |
| Standard Deviation (Sample) | 29.4% | 8.6% |
| Standard Deviation (Population) | 29.3% | 8.6% |
Correlation Details
| Native/Alaskan Percentile | Sample Size | Wage/Income Gap |
[ 0.0% - 0.5% ] 0.21% | 288,255,512 | 27.4% |
[ 0.5% - 1.0% ] 0.71% | 118,578,228 | 25.2% |
[ 1.0% - 1.5% ] 1.20% | 51,415,835 | 24.5% |
[ 1.5% - 2.0% ] 1.72% | 18,074,854 | 25.5% |
[ 2.0% - 2.5% ] 2.20% | 10,991,082 | 23.4% |
[ 2.5% - 3.0% ] 2.71% | 4,817,968 | 23.6% |
[ 3.0% - 3.5% ] 3.26% | 4,340,970 | 24.6% |
[ 3.5% - 4.0% ] 3.72% | 2,048,347 | 24.7% |
[ 4.0% - 4.5% ] 4.26% | 2,554,908 | 27.9% |
[ 4.5% - 5.0% ] 4.76% | 1,799,941 | 24.9% |
[ 5.0% - 5.5% ] 5.22% | 675,302 | 29.1% |
[ 5.5% - 6.0% ] 5.73% | 842,761 | 28.9% |
[ 6.0% - 6.5% ] 6.25% | 645,714 | 29.0% |
[ 6.5% - 7.0% ] 6.74% | 369,268 | 31.0% |
[ 7.0% - 7.5% ] 7.33% | 686,619 | 26.5% |
[ 7.5% - 8.0% ] 7.70% | 354,641 | 28.2% |
[ 8.0% - 8.5% ] 8.21% | 377,410 | 26.6% |
[ 8.5% - 9.0% ] 8.72% | 398,641 | 21.2% |
[ 9.0% - 9.5% ] 9.23% | 271,669 | 24.9% |
[ 9.5% - 10.0% ] 9.79% | 241,587 | 27.0% |
[ 10.0% - 10.5% ] 10.25% | 153,795 | 23.5% |
[ 10.5% - 11.0% ] 10.69% | 130,328 | 31.2% |
[ 11.0% - 11.5% ] 11.32% | 182,750 | 28.8% |
[ 11.5% - 12.0% ] 11.78% | 197,846 | 26.2% |
[ 12.0% - 12.5% ] 12.23% | 228,765 | 25.3% |
[ 12.5% - 13.0% ] 12.76% | 134,582 | 31.1% |
[ 13.0% - 13.5% ] 13.27% | 93,289 | 32.1% |
[ 13.5% - 14.0% ] 13.81% | 139,565 | 25.8% |
[ 14.0% - 14.5% ] 14.28% | 70,079 | 28.0% |
[ 14.5% - 15.0% ] 14.77% | 99,777 | 25.2% |
[ 15.0% - 15.5% ] 15.24% | 112,469 | 27.8% |
[ 15.5% - 16.0% ] 15.65% | 64,231 | 29.2% |
[ 16.0% - 16.5% ] 16.33% | 33,249 | 30.9% |
[ 16.5% - 17.0% ] 16.65% | 84,052 | 26.0% |
[ 17.0% - 17.5% ] 17.23% | 87,821 | 27.2% |
[ 17.5% - 18.0% ] 17.85% | 98,080 | 29.2% |
[ 18.0% - 18.5% ] 18.13% | 125,894 | 26.9% |
[ 18.5% - 19.0% ] 18.70% | 38,388 | 27.2% |
[ 19.0% - 19.5% ] 19.31% | 88,168 | 28.0% |
[ 19.5% - 20.0% ] 19.82% | 42,926 | 17.0% |
[ 20.0% - 20.5% ] 20.32% | 39,015 | 22.1% |
[ 20.5% - 21.0% ] 20.85% | 31,882 | 31.8% |
[ 21.0% - 21.5% ] 21.40% | 26,737 | 34.0% |
[ 21.5% - 22.0% ] 21.81% | 39,015 | 26.2% |
[ 22.0% - 22.5% ] 22.18% | 8,556 | 27.9% |
[ 22.5% - 23.0% ] 22.66% | 35,384 | 25.0% |
[ 23.0% - 23.5% ] 23.18% | 15,542 | 22.3% |
[ 23.5% - 24.0% ] 23.73% | 22,984 | 26.5% |
[ 24.0% - 24.5% ] 24.27% | 24,970 | 37.1% |
[ 24.5% - 25.0% ] 24.78% | 19,562 | 27.2% |
[ 25.0% - 25.5% ] 25.40% | 15,451 | 21.6% |
[ 25.5% - 26.0% ] 25.78% | 14,151 | 23.1% |
[ 26.0% - 26.5% ] 26.20% | 12,971 | 21.8% |
[ 26.5% - 27.0% ] 26.71% | 7,747 | 39.1% |
[ 27.0% - 27.5% ] 27.46% | 13,790 | 18.1% |
[ 27.5% - 28.0% ] 27.81% | 17,449 | 35.1% |
[ 28.0% - 28.5% ] 28.48% | 55,430 | 32.5% |
[ 28.5% - 29.0% ] 28.69% | 6,661 | 18.0% |
[ 29.0% - 29.5% ] 29.20% | 8,437 | 33.7% |
[ 29.5% - 30.0% ] 29.80% | 34,612 | 29.6% |
[ 30.0% - 30.5% ] 30.09% | 29,682 | 26.7% |
[ 30.5% - 31.0% ] 30.81% | 9,861 | 27.4% |
[ 31.0% - 31.5% ] 31.35% | 9,279 | 26.2% |
[ 31.5% - 32.0% ] 31.70% | 5,840 | 19.6% |
[ 32.0% - 32.5% ] 32.31% | 19,903 | 24.4% |
[ 32.5% - 33.0% ] 32.60% | 5,702 | 22.9% |
[ 33.0% - 33.5% ] 33.17% | 59,155 | 33.6% |
[ 33.5% - 34.0% ] 33.78% | 8,084 | 35.3% |
[ 34.0% - 34.5% ] 34.33% | 36,060 | 16.7% |
[ 34.5% - 35.0% ] 34.88% | 11,778 | 27.5% |
[ 35.0% - 35.5% ] 35.34% | 5,532 | 23.5% |
[ 35.5% - 36.0% ] 35.71% | 18,283 | 23.3% |
[ 36.0% - 36.5% ] 36.34% | 4,122 | 13.7% |
[ 36.5% - 37.0% ] 36.94% | 1,711 | 4.2% |
[ 37.0% - 37.5% ] 37.08% | 10,514 | 9.8% |
[ 37.5% - 38.0% ] 37.76% | 12,216 | 27.5% |
[ 38.0% - 38.5% ] 38.23% | 11,053 | 32.0% |
[ 38.5% - 39.0% ] 38.71% | 8,080 | 12.1% |
[ 39.0% - 39.5% ] 39.21% | 6,643 | 14.5% |
[ 39.5% - 40.0% ] 39.91% | 4,505 | 16.4% |
[ 40.0% - 40.5% ] 40.19% | 4,959 | 30.3% |
[ 40.5% - 41.0% ] 40.73% | 1,370 | 26.8% |
[ 41.0% - 41.5% ] 41.14% | 4,429 | 16.3% |
[ 42.0% - 42.5% ] 42.35% | 1,327 | 31.3% |
[ 42.5% - 43.0% ] 42.69% | 6,409 | 36.1% |
[ 43.0% - 43.5% ] 43.28% | 2,112 | 35.5% |
[ 43.5% - 44.0% ] 43.76% | 2,854 | 24.4% |
[ 44.0% - 44.5% ] 44.34% | 981 | 43.4% |
[ 45.0% - 45.5% ] 45.26% | 2,329 | 25.4% |
[ 45.5% - 46.0% ] 45.69% | 348 | 15.3% |
[ 46.0% - 46.5% ] 46.33% | 1,200 | 39.4% |
[ 46.5% - 47.0% ] 46.55% | 14,893 | 6.6% |
[ 47.0% - 47.5% ] 47.29% | 4,060 | 22.1% |
[ 47.5% - 48.0% ] 47.68% | 22,712 | 12.6% |
[ 48.0% - 48.5% ] 48.17% | 6,560 | 12.9% |
[ 48.5% - 49.0% ] 48.69% | 1,877 | 29.2% |
[ 49.0% - 49.5% ] 49.17% | 28,147 | 17.7% |
[ 49.5% - 50.0% ] 49.73% | 4,997 | 28.8% |
[ 50.0% - 50.5% ] 50.32% | 1,393 | 16.0% |
[ 50.5% - 51.0% ] 50.81% | 6,140 | 40.0% |
[ 51.0% - 51.5% ] 51.26% | 2,544 | 34.2% |
[ 51.5% - 52.0% ] 51.68% | 5,371 | 18.1% |
[ 52.0% - 52.5% ] 52.28% | 2,548 | 19.8% |
[ 52.5% - 53.0% ] 52.95% | 644 | 11.2% |
[ 53.0% - 53.5% ] 53.19% | 14,688 | 3.1% |
[ 53.5% - 54.0% ] 53.70% | 16,825 | 17.4% |
[ 54.0% - 54.5% ] 54.25% | 1,329 | 28.2% |
[ 54.5% - 55.0% ] 54.90% | 5,621 | 19.3% |
[ 55.0% - 55.5% ] 55.43% | 9,967 | 5.6% |
[ 55.5% - 56.0% ] 55.69% | 9,050 | 35.7% |
[ 56.0% - 56.5% ] 56.15% | 1,699 | 3.8% |
[ 56.5% - 57.0% ] 56.80% | 2,391 | 18.9% |
[ 58.0% - 58.5% ] 58.27% | 5,859 | 9.8% |
[ 58.5% - 59.0% ] 58.57% | 1,103 | 8.4% |
[ 59.0% - 59.5% ] 59.04% | 293 | 24.0% |
[ 60.0% - 60.5% ] 60.37% | 5,846 | 19.9% |
[ 60.5% - 61.0% ] 60.62% | 8,294 | 23.9% |
[ 61.0% - 61.5% ] 61.26% | 14,313 | 7.2% |
[ 62.0% - 62.5% ] 62.06% | 1,434 | 30.0% |
[ 62.5% - 63.0% ] 62.62% | 4,438 | 18.7% |
[ 63.0% - 63.5% ] 63.16% | 2,481 | 18.3% |
[ 63.5% - 64.0% ] 63.80% | 11,359 | 41.6% |
[ 64.0% - 64.5% ] 64.21% | 3,663 | 23.6% |
[ 64.5% - 65.0% ] 64.77% | 12,309 | 7.6% |
[ 65.0% - 65.5% ] 65.24% | 13,632 | 21.2% |
[ 65.5% - 66.0% ] 65.75% | 1,746 | 29.2% |
[ 66.0% - 66.5% ] 66.13% | 2,380 | 28.1% |
[ 66.5% - 67.0% ] 66.79% | 804 | 27.3% |
[ 67.0% - 67.5% ] 67.11% | 4,214 | 28.3% |
[ 67.5% - 68.0% ] 67.71% | 11,170 | 24.4% |
[ 68.0% - 68.5% ] 68.46% | 241 | 48.8% |
[ 68.5% - 69.0% ] 68.90% | 14,947 | 6.3% |
[ 69.0% - 69.5% ] 69.37% | 4,391 | 16.1% |
[ 69.5% - 70.0% ] 69.82% | 676 | 24.4% |
[ 70.0% - 70.5% ] 70.38% | 574 | 42.8% |
[ 70.5% - 71.0% ] 70.65% | 1,530 | 19.4% |
[ 71.0% - 71.5% ] 71.18% | 4,143 | 18.2% |
[ 71.5% - 72.0% ] 71.85% | 2,714 | 5.2% |
[ 72.0% - 72.5% ] 72.39% | 11,661 | 21.8% |
[ 72.5% - 73.0% ] 72.82% | 206 | 11.4% |
[ 73.0% - 73.5% ] 73.31% | 19,043 | 23.5% |
[ 74.0% - 74.5% ] 74.06% | 3,632 | 19.1% |
[ 74.5% - 75.0% ] 74.79% | 4,963 | 38.0% |
[ 75.0% - 75.5% ] 75.22% | 3,248 | 16.1% |
[ 75.5% - 76.0% ] 75.59% | 299 | 20.9% |
[ 76.0% - 76.5% ] 76.30% | 5,465 | 16.8% |
[ 76.5% - 77.0% ] 76.67% | 9,015 | 30.8% |
[ 77.0% - 77.5% ] 77.24% | 1,661 | 17.8% |
[ 78.0% - 78.5% ] 78.31% | 1,535 | 24.1% |
[ 79.0% - 79.5% ] 79.26% | 11,584 | 18.3% |
[ 79.5% - 80.0% ] 79.72% | 10,217 | 21.5% |
[ 80.0% - 80.5% ] 80.16% | 7,691 | 7.2% |
[ 80.5% - 81.0% ] 80.88% | 4,100 | 8.7% |
[ 81.0% - 81.5% ] 81.33% | 2,683 | 25.9% |
[ 81.5% - 82.0% ] 81.78% | 4,258 | 36.6% |
[ 82.0% - 82.5% ] 82.38% | 1,402 | 32.3% |
[ 82.5% - 83.0% ] 82.70% | 5,405 | 17.3% |
[ 83.0% - 83.5% ] 83.39% | 13,728 | 22.5% |
[ 83.5% - 84.0% ] 83.79% | 6,656 | 20.6% |
[ 84.0% - 84.5% ] 84.26% | 3,309 | 21.4% |
[ 84.5% - 85.0% ] 84.84% | 23,414 | 8.5% |
[ 85.0% - 85.5% ] 85.31% | 7,489 | 28.6% |
[ 85.5% - 86.0% ] 85.68% | 8,952 | 18.8% |
[ 86.0% - 86.5% ] 86.25% | 1,520 | 27.2% |
[ 86.5% - 87.0% ] 86.60% | 6,932 | 41.5% |
[ 87.0% - 87.5% ] 87.29% | 2,070 | 35.5% |
[ 87.5% - 88.0% ] 87.86% | 6,968 | 17.2% |
[ 88.0% - 88.5% ] 88.16% | 7,303 | 20.5% |
[ 88.5% - 89.0% ] 88.64% | 15,469 | 15.6% |
[ 89.0% - 89.5% ] 89.36% | 10,016 | 20.0% |
[ 89.5% - 90.0% ] 89.86% | 2,752 | 20.1% |
[ 90.0% - 90.5% ] 90.32% | 7,956 | 18.3% |
[ 90.5% - 91.0% ] 90.63% | 18,611 | 28.1% |
[ 91.0% - 91.5% ] 91.17% | 16,123 | 15.2% |
[ 91.5% - 92.0% ] 91.67% | 6,208 | 9.2% |
[ 92.0% - 92.5% ] 92.28% | 16,173 | 8.2% |
[ 92.5% - 93.0% ] 92.84% | 39,643 | 11.9% |
[ 93.0% - 93.5% ] 93.16% | 17,549 | 15.6% |
[ 93.5% - 94.0% ] 93.79% | 28,096 | 14.2% |
[ 94.0% - 94.5% ] 94.15% | 15,341 | 8.9% |
[ 94.5% - 95.0% ] 94.75% | 37,172 | 14.0% |
[ 95.0% - 95.5% ] 95.21% | 20,460 | 21.2% |
[ 95.5% - 96.0% ] 95.70% | 31,498 | 10.4% |
[ 96.0% - 96.5% ] 96.25% | 20,180 | 26.5% |
[ 96.5% - 97.0% ] 96.57% | 23,663 | 14.0% |
[ 97.0% - 97.5% ] 97.26% | 10,047 | 20.6% |
[ 97.5% - 98.0% ] 97.75% | 30,514 | 16.7% |
[ 98.0% - 98.5% ] 98.28% | 17,302 | 28.6% |
[ 98.5% - 99.0% ] 98.80% | 12,511 | 28.4% |
[ 99.0% - 99.5% ] 99.27% | 15,928 | 19.4% |
[ 99.5% - 100.0% ] 99.99% | 12,864 | 29.0% |