Honduran Wage/Income Gap
COMPARE
Honduran
Select to Compare
Wage/Income Gap
Honduran Wage/Income Gap
23.6%
WAGE/INCOME GAP
99.5/ 100
METRIC RATING
94th/ 347
METRIC RANK
Honduran Wage/Income Gap Correlation Chart
The statistical analysis conducted on geographies consisting of 357,631,744 people shows a weak positive correlation between the proportion of Hondurans and wage/income gap percentage in the United States with a correlation coefficient (R) of 0.281 and weighted average of 23.6%. On average, for every 1% (one percent) increase in Hondurans within a typical geography, there is an increase of 0.46% in wage/income gap percentage.
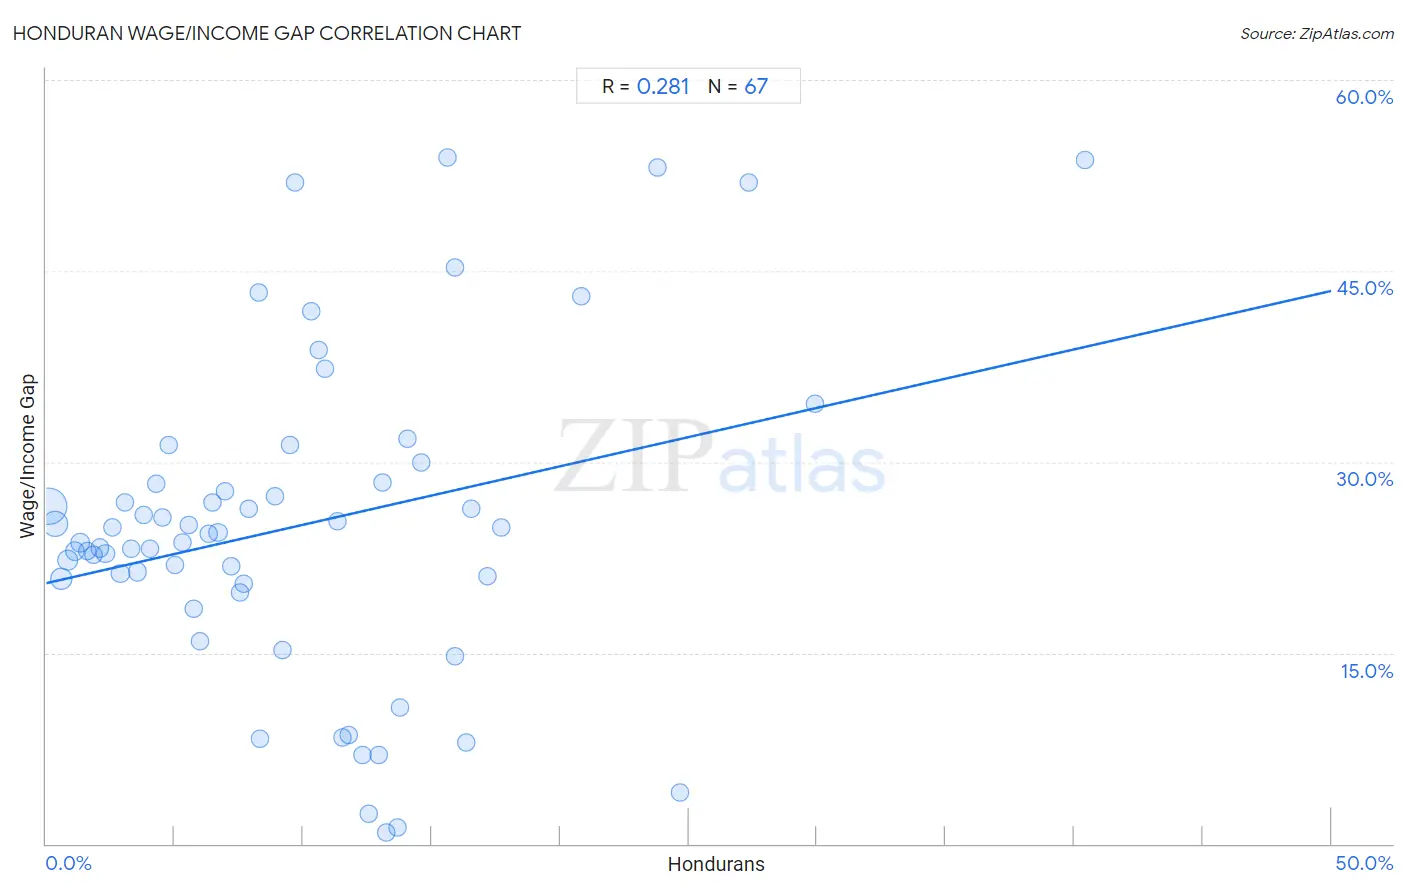
It is essential to understand that the correlation between the percentage of Hondurans and wage/income gap percentage does not imply a direct cause-and-effect relationship. It remains uncertain whether the presence of Hondurans influences an upward or downward trend in the level of wage/income gap percentage within an area, or if Hondurans simply ended up residing in those areas with higher or lower levels of wage/income gap percentage due to other factors.
Demographics Similar to Hondurans by Wage/Income Gap
In terms of wage/income gap, the demographic groups most similar to Hondurans are Cape Verdean (23.6%, a difference of 0.030%), Immigrants from Cabo Verde (23.6%, a difference of 0.090%), Kiowa (23.6%, a difference of 0.15%), Immigrants from Sudan (23.6%, a difference of 0.24%), and Immigrants from Honduras (23.5%, a difference of 0.33%).
| Demographics | Rating | Rank | Wage/Income Gap |
| Yuman | 99.7 /100 | #87 | Exceptional 23.3% |
| Immigrants from Panama | 99.6 /100 | #88 | Exceptional 23.4% |
| Marshallese | 99.6 /100 | #89 | Exceptional 23.4% |
| Nicaraguans | 99.6 /100 | #90 | Exceptional 23.4% |
| Arapaho | 99.6 /100 | #91 | Exceptional 23.5% |
| Immigrants from Honduras | 99.5 /100 | #92 | Exceptional 23.5% |
| Immigrants from Cabo Verde | 99.5 /100 | #93 | Exceptional 23.6% |
| Hondurans | 99.5 /100 | #94 | Exceptional 23.6% |
| Cape Verdeans | 99.4 /100 | #95 | Exceptional 23.6% |
| Kiowa | 99.4 /100 | #96 | Exceptional 23.6% |
| Immigrants from Sudan | 99.4 /100 | #97 | Exceptional 23.6% |
| Immigrants from Latin America | 99.2 /100 | #98 | Exceptional 23.7% |
| Aleuts | 99.2 /100 | #99 | Exceptional 23.7% |
| Yakama | 99.2 /100 | #100 | Exceptional 23.7% |
| Japanese | 99.1 /100 | #101 | Exceptional 23.8% |
Honduran Wage/Income Gap Correlation Summary
| Measurement | Honduran Data | Wage/Income Gap Data |
| Minimum | 0.10% | 0.90% |
| Maximum | 40.4% | 53.9% |
| Range | 40.3% | 53.0% |
| Mean | 9.8% | 25.0% |
| Median | 8.3% | 24.4% |
| Interquartile 25% (IQ1) | 4.0% | 20.4% |
| Interquartile 75% (IQ3) | 13.7% | 28.4% |
| Interquartile Range (IQR) | 9.7% | 8.0% |
| Standard Deviation (Sample) | 7.7% | 12.6% |
| Standard Deviation (Population) | 7.6% | 12.5% |
Correlation Details
| Honduran Percentile | Sample Size | Wage/Income Gap |
[ 0.0% - 0.5% ] 0.10% | 181,157,164 | 26.5% |
[ 0.0% - 0.5% ] 0.36% | 69,864,487 | 25.2% |
[ 0.5% - 1.0% ] 0.59% | 35,537,541 | 20.8% |
[ 0.5% - 1.0% ] 0.83% | 20,432,115 | 22.3% |
[ 1.0% - 1.5% ] 1.10% | 13,104,993 | 23.0% |
[ 1.0% - 1.5% ] 1.33% | 7,996,367 | 23.6% |
[ 1.5% - 2.0% ] 1.58% | 4,134,022 | 23.0% |
[ 1.5% - 2.0% ] 1.83% | 3,807,114 | 22.7% |
[ 2.0% - 2.5% ] 2.09% | 2,630,308 | 23.2% |
[ 2.0% - 2.5% ] 2.30% | 3,352,445 | 22.8% |
[ 2.5% - 3.0% ] 2.57% | 1,988,832 | 24.9% |
[ 2.5% - 3.0% ] 2.88% | 4,250,046 | 21.2% |
[ 3.0% - 3.5% ] 3.05% | 1,541,569 | 26.8% |
[ 3.0% - 3.5% ] 3.32% | 746,834 | 23.2% |
[ 3.5% - 4.0% ] 3.54% | 917,893 | 21.4% |
[ 3.5% - 4.0% ] 3.78% | 717,281 | 25.8% |
[ 4.0% - 4.5% ] 4.02% | 615,093 | 23.2% |
[ 4.0% - 4.5% ] 4.27% | 522,510 | 28.2% |
[ 4.5% - 5.0% ] 4.53% | 660,427 | 25.6% |
[ 4.5% - 5.0% ] 4.78% | 332,144 | 31.4% |
[ 5.0% - 5.5% ] 5.01% | 463,437 | 21.9% |
[ 5.0% - 5.5% ] 5.29% | 425,284 | 23.7% |
[ 5.5% - 6.0% ] 5.54% | 72,443 | 25.1% |
[ 5.5% - 6.0% ] 5.74% | 202,389 | 18.5% |
[ 5.5% - 6.0% ] 5.96% | 189,905 | 15.9% |
[ 6.0% - 6.5% ] 6.30% | 76,535 | 24.4% |
[ 6.0% - 6.5% ] 6.48% | 39,601 | 26.8% |
[ 6.5% - 7.0% ] 6.69% | 599,575 | 24.4% |
[ 6.5% - 7.0% ] 6.97% | 153,146 | 27.7% |
[ 7.0% - 7.5% ] 7.19% | 92,659 | 21.8% |
[ 7.5% - 8.0% ] 7.52% | 47,577 | 19.7% |
[ 7.5% - 8.0% ] 7.67% | 65,149 | 20.4% |
[ 7.5% - 8.0% ] 7.88% | 84,865 | 26.3% |
[ 8.0% - 8.5% ] 8.26% | 3,305 | 43.3% |
[ 8.0% - 8.5% ] 8.32% | 9,311 | 8.2% |
[ 8.5% - 9.0% ] 8.91% | 28,839 | 27.3% |
[ 9.0% - 9.5% ] 9.20% | 133,414 | 15.2% |
[ 9.5% - 10.0% ] 9.51% | 68,158 | 31.3% |
[ 9.5% - 10.0% ] 9.67% | 11,924 | 52.0% |
[ 10.0% - 10.5% ] 10.29% | 33,529 | 41.9% |
[ 10.5% - 11.0% ] 10.62% | 70,579 | 38.7% |
[ 10.5% - 11.0% ] 10.85% | 60,388 | 37.3% |
[ 11.0% - 11.5% ] 11.32% | 74,024 | 25.4% |
[ 11.5% - 12.0% ] 11.54% | 61,156 | 8.3% |
[ 11.5% - 12.0% ] 11.76% | 8,750 | 8.6% |
[ 12.0% - 12.5% ] 12.32% | 406 | 7.0% |
[ 12.5% - 13.0% ] 12.54% | 1,699 | 2.3% |
[ 12.5% - 13.0% ] 12.92% | 9,070 | 7.0% |
[ 13.0% - 13.5% ] 13.07% | 35,787 | 28.4% |
[ 13.0% - 13.5% ] 13.21% | 18,496 | 0.90% |
[ 13.5% - 14.0% ] 13.67% | 16,743 | 1.3% |
[ 13.5% - 14.0% ] 13.79% | 28,306 | 10.7% |
[ 14.0% - 14.5% ] 14.04% | 62,599 | 31.8% |
[ 14.5% - 15.0% ] 14.58% | 48 | 30.0% |
[ 15.5% - 16.0% ] 15.62% | 1,088 | 53.9% |
[ 15.5% - 16.0% ] 15.88% | 3,098 | 45.2% |
[ 15.5% - 16.0% ] 15.92% | 2,581 | 14.8% |
[ 16.0% - 16.5% ] 16.36% | 26,105 | 8.0% |
[ 16.5% - 17.0% ] 16.54% | 6,947 | 26.3% |
[ 17.0% - 17.5% ] 17.16% | 16,930 | 21.0% |
[ 17.5% - 18.0% ] 17.69% | 944 | 24.8% |
[ 20.5% - 21.0% ] 20.80% | 8,989 | 43.0% |
[ 23.5% - 24.0% ] 23.77% | 774 | 53.1% |
[ 24.5% - 25.0% ] 24.67% | 3,559 | 4.0% |
[ 27.0% - 27.5% ] 27.34% | 673 | 51.9% |
[ 29.5% - 30.0% ] 29.94% | 1,540 | 34.6% |
[ 40.0% - 40.5% ] 40.43% | 235 | 53.7% |