Hispanic or Latino Wage/Income Gap
COMPARE
Hispanic or Latino
Select to Compare
Wage/Income Gap
Hispanic or Latino Wage/Income Gap
24.9%
WAGE/INCOME GAP
89.5/ 100
METRIC RATING
139th/ 347
METRIC RANK
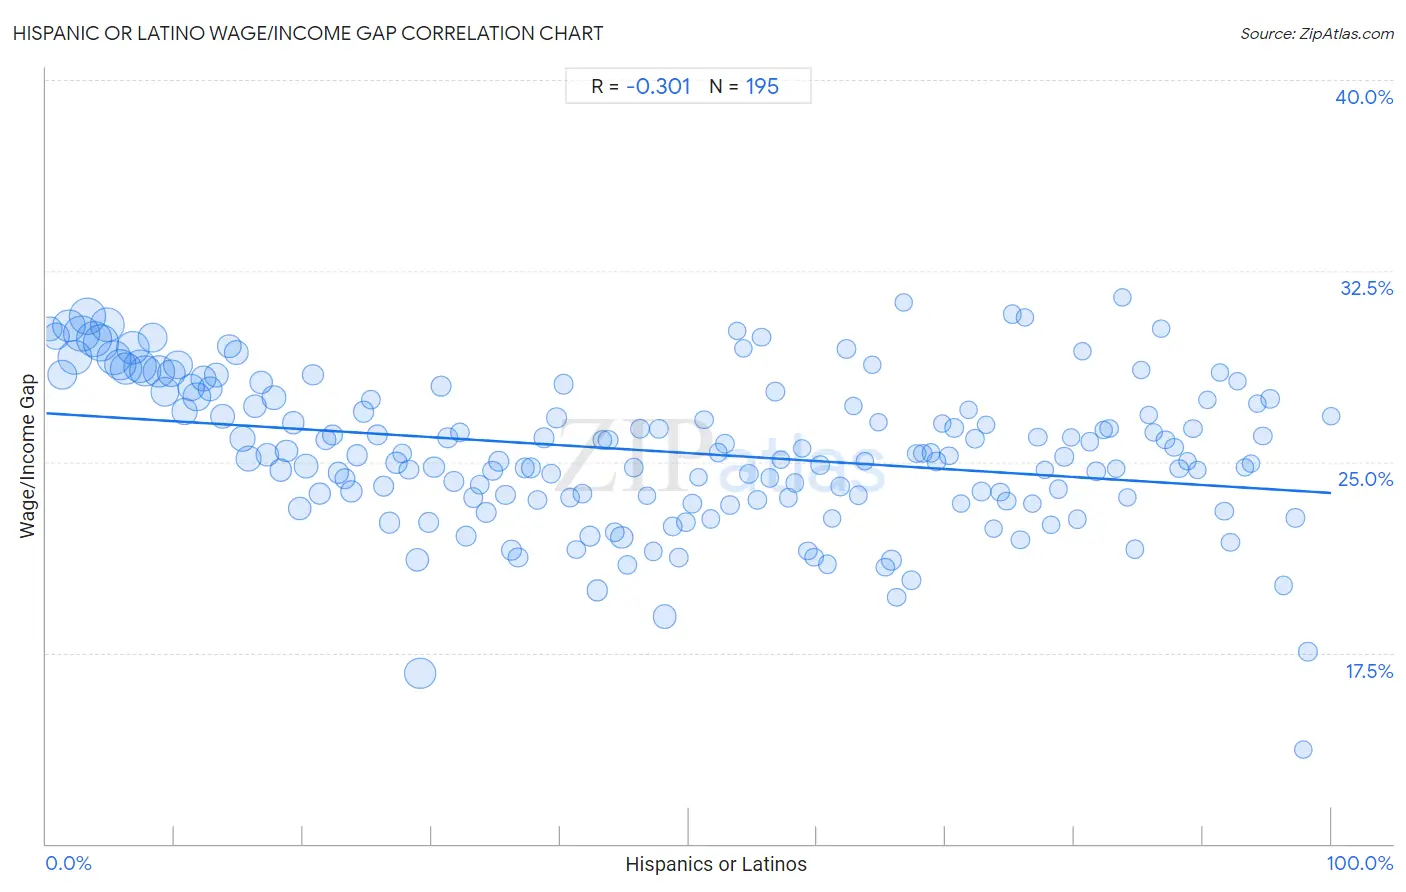
Hispanic or Latino Wage/Income Gap Correlation Chart
The statistical analysis conducted on geographies consisting of 570,699,475 people shows a mild negative correlation between the proportion of Hispanics or Latinos and wage/income gap percentage in the United States with a correlation coefficient (R) of -0.301 and weighted average of 24.9%. On average, for every 1% (one percent) increase in Hispanics or Latinos within a typical geography, there is a decrease of 0.031% in wage/income gap percentage.
It is essential to understand that the correlation between the percentage of Hispanics or Latinos and wage/income gap percentage does not imply a direct cause-and-effect relationship. It remains uncertain whether the presence of Hispanics or Latinos influences an upward or downward trend in the level of wage/income gap percentage within an area, or if Hispanics or Latinos simply ended up residing in those areas with higher or lower levels of wage/income gap percentage due to other factors.
Demographics Similar to Hispanics or Latinos by Wage/Income Gap
In terms of wage/income gap, the demographic groups most similar to Hispanics or Latinos are Immigrants from Nepal (24.9%, a difference of 0.030%), Hawaiian (24.9%, a difference of 0.040%), Immigrants from Bosnia and Herzegovina (24.8%, a difference of 0.11%), Afghan (24.9%, a difference of 0.24%), and Immigrants from Uganda (24.9%, a difference of 0.25%).
| Demographics | Rating | Rank | Wage/Income Gap |
| Immigrants from Costa Rica | 92.4 /100 | #132 | Exceptional 24.7% |
| Colombians | 92.4 /100 | #133 | Exceptional 24.7% |
| Mexican American Indians | 92.2 /100 | #134 | Exceptional 24.7% |
| South American Indians | 92.0 /100 | #135 | Exceptional 24.7% |
| Armenians | 91.3 /100 | #136 | Exceptional 24.8% |
| Immigrants from South Eastern Asia | 90.9 /100 | #137 | Exceptional 24.8% |
| Immigrants from Bosnia and Herzegovina | 90.1 /100 | #138 | Exceptional 24.8% |
| Hispanics or Latinos | 89.5 /100 | #139 | Excellent 24.9% |
| Immigrants from Nepal | 89.3 /100 | #140 | Excellent 24.9% |
| Hawaiians | 89.3 /100 | #141 | Excellent 24.9% |
| Afghans | 88.1 /100 | #142 | Excellent 24.9% |
| Immigrants from Uganda | 88.0 /100 | #143 | Excellent 24.9% |
| Chippewa | 86.9 /100 | #144 | Excellent 25.0% |
| Comanche | 85.2 /100 | #145 | Excellent 25.0% |
| South Americans | 85.2 /100 | #146 | Excellent 25.0% |
Hispanic or Latino Wage/Income Gap Correlation Summary
| Measurement | Hispanic or Latino Data | Wage/Income Gap Data |
| Minimum | 0.28% | 13.7% |
| Maximum | 100.0% | 31.5% |
| Range | 99.7% | 17.8% |
| Mean | 48.8% | 25.4% |
| Median | 48.8% | 25.3% |
| Interquartile 25% (IQ1) | 24.2% | 23.6% |
| Interquartile 75% (IQ3) | 73.2% | 27.5% |
| Interquartile Range (IQR) | 49.0% | 3.9% |
| Standard Deviation (Sample) | 28.3% | 2.9% |
| Standard Deviation (Population) | 28.3% | 2.9% |
Correlation Details
| Hispanic or Latino Percentile | Sample Size | Wage/Income Gap |
[ 0.0% - 0.5% ] 0.28% | 5,544,347 | 30.2% |
[ 0.5% - 1.0% ] 0.77% | 8,173,076 | 29.9% |
[ 1.0% - 1.5% ] 1.26% | 10,775,047 | 28.4% |
[ 1.5% - 2.0% ] 1.76% | 13,362,119 | 30.4% |
[ 2.0% - 2.5% ] 2.26% | 15,039,050 | 29.1% |
[ 2.5% - 3.0% ] 2.75% | 16,392,222 | 30.1% |
[ 3.0% - 3.5% ] 3.25% | 17,080,175 | 30.7% |
[ 3.5% - 4.0% ] 3.74% | 15,373,129 | 29.8% |
[ 4.0% - 4.5% ] 4.26% | 16,467,898 | 29.7% |
[ 4.5% - 5.0% ] 4.73% | 15,156,118 | 30.4% |
[ 5.0% - 5.5% ] 5.25% | 14,426,728 | 29.1% |
[ 5.5% - 6.0% ] 5.75% | 11,966,800 | 28.8% |
[ 6.0% - 6.5% ] 6.24% | 12,865,513 | 28.7% |
[ 6.5% - 7.0% ] 6.75% | 13,157,014 | 29.5% |
[ 7.0% - 7.5% ] 7.26% | 13,630,839 | 28.8% |
[ 7.5% - 8.0% ] 7.73% | 12,113,412 | 28.6% |
[ 8.0% - 8.5% ] 8.24% | 10,088,475 | 29.9% |
[ 8.5% - 9.0% ] 8.76% | 12,284,085 | 28.5% |
[ 9.0% - 9.5% ] 9.24% | 9,306,872 | 27.8% |
[ 9.5% - 10.0% ] 9.75% | 8,937,388 | 28.5% |
[ 10.0% - 10.5% ] 10.25% | 9,350,974 | 28.8% |
[ 10.5% - 11.0% ] 10.77% | 7,703,688 | 27.0% |
[ 11.0% - 11.5% ] 11.24% | 8,095,645 | 27.9% |
[ 11.5% - 12.0% ] 11.72% | 8,158,888 | 27.6% |
[ 12.0% - 12.5% ] 12.25% | 7,311,584 | 28.3% |
[ 12.5% - 13.0% ] 12.74% | 5,614,933 | 27.9% |
[ 13.0% - 13.5% ] 13.24% | 5,617,045 | 28.4% |
[ 13.5% - 14.0% ] 13.74% | 5,684,092 | 26.8% |
[ 14.0% - 14.5% ] 14.24% | 4,762,319 | 29.5% |
[ 14.5% - 15.0% ] 14.76% | 5,664,722 | 29.3% |
[ 15.0% - 15.5% ] 15.28% | 6,841,905 | 25.9% |
[ 15.5% - 16.0% ] 15.73% | 7,249,640 | 25.1% |
[ 16.0% - 16.5% ] 16.25% | 4,701,152 | 27.2% |
[ 16.5% - 17.0% ] 16.71% | 4,791,963 | 28.1% |
[ 17.0% - 17.5% ] 17.23% | 4,993,992 | 25.3% |
[ 17.5% - 18.0% ] 17.72% | 5,462,588 | 27.5% |
[ 18.0% - 18.5% ] 18.25% | 4,425,210 | 24.7% |
[ 18.5% - 19.0% ] 18.72% | 4,097,704 | 25.4% |
[ 19.0% - 19.5% ] 19.23% | 4,298,487 | 26.5% |
[ 19.5% - 20.0% ] 19.71% | 5,122,532 | 23.2% |
[ 20.0% - 20.5% ] 20.25% | 6,055,882 | 24.8% |
[ 20.5% - 21.0% ] 20.76% | 2,678,256 | 28.4% |
[ 21.0% - 21.5% ] 21.26% | 3,818,135 | 23.8% |
[ 21.5% - 22.0% ] 21.75% | 2,969,409 | 25.9% |
[ 22.0% - 22.5% ] 22.26% | 2,374,025 | 26.0% |
[ 22.5% - 23.0% ] 22.73% | 3,021,021 | 24.6% |
[ 23.0% - 23.5% ] 23.28% | 2,477,421 | 24.3% |
[ 23.5% - 24.0% ] 23.74% | 3,211,905 | 23.8% |
[ 24.0% - 24.5% ] 24.19% | 3,157,952 | 25.3% |
[ 24.5% - 25.0% ] 24.73% | 2,604,643 | 27.0% |
[ 25.0% - 25.5% ] 25.27% | 1,864,088 | 27.5% |
[ 25.5% - 26.0% ] 25.73% | 2,567,224 | 26.0% |
[ 26.0% - 26.5% ] 26.23% | 2,545,819 | 24.1% |
[ 26.5% - 27.0% ] 26.71% | 3,142,884 | 22.6% |
[ 27.0% - 27.5% ] 27.24% | 3,032,283 | 25.0% |
[ 27.5% - 28.0% ] 27.72% | 1,767,931 | 25.3% |
[ 28.0% - 28.5% ] 28.24% | 1,998,250 | 24.7% |
[ 28.5% - 29.0% ] 28.86% | 4,910,195 | 21.2% |
[ 29.0% - 29.5% ] 29.10% | 12,267,912 | 16.7% |
[ 29.5% - 30.0% ] 29.77% | 2,499,244 | 22.6% |
[ 30.0% - 30.5% ] 30.19% | 3,009,417 | 24.8% |
[ 30.5% - 31.0% ] 30.77% | 2,570,861 | 28.0% |
[ 31.0% - 31.5% ] 31.24% | 1,907,775 | 26.0% |
[ 31.5% - 32.0% ] 31.76% | 2,111,501 | 24.2% |
[ 32.0% - 32.5% ] 32.21% | 1,400,316 | 26.1% |
[ 32.5% - 33.0% ] 32.64% | 2,577,703 | 22.1% |
[ 33.0% - 33.5% ] 33.25% | 2,089,226 | 23.6% |
[ 33.5% - 34.0% ] 33.74% | 1,723,220 | 24.1% |
[ 34.0% - 34.5% ] 34.26% | 2,422,138 | 23.0% |
[ 34.5% - 35.0% ] 34.72% | 2,128,885 | 24.6% |
[ 35.0% - 35.5% ] 35.21% | 2,311,052 | 25.0% |
[ 35.5% - 36.0% ] 35.74% | 1,463,396 | 23.7% |
[ 36.0% - 36.5% ] 36.22% | 2,014,260 | 21.5% |
[ 36.5% - 37.0% ] 36.71% | 1,391,592 | 21.3% |
[ 37.0% - 37.5% ] 37.24% | 1,594,004 | 24.8% |
[ 37.5% - 38.0% ] 37.74% | 1,719,729 | 24.8% |
[ 38.0% - 38.5% ] 38.21% | 1,300,713 | 23.5% |
[ 38.5% - 39.0% ] 38.75% | 1,878,500 | 26.0% |
[ 39.0% - 39.5% ] 39.27% | 1,467,805 | 24.5% |
[ 39.5% - 40.0% ] 39.72% | 1,751,757 | 26.7% |
[ 40.0% - 40.5% ] 40.25% | 1,566,546 | 28.1% |
[ 40.5% - 41.0% ] 40.79% | 1,075,257 | 23.6% |
[ 41.0% - 41.5% ] 41.26% | 1,039,951 | 21.6% |
[ 41.5% - 42.0% ] 41.74% | 1,393,019 | 23.7% |
[ 42.0% - 42.5% ] 42.33% | 2,555,202 | 22.1% |
[ 42.5% - 43.0% ] 42.85% | 2,831,410 | 19.9% |
[ 43.0% - 43.5% ] 43.25% | 1,356,685 | 25.9% |
[ 43.5% - 44.0% ] 43.72% | 1,282,921 | 25.9% |
[ 44.0% - 44.5% ] 44.23% | 1,722,945 | 22.2% |
[ 44.5% - 45.0% ] 44.78% | 3,741,593 | 22.0% |
[ 45.0% - 45.5% ] 45.24% | 1,517,341 | 21.0% |
[ 45.5% - 46.0% ] 45.74% | 1,202,791 | 24.8% |
[ 46.0% - 46.5% ] 46.22% | 1,252,806 | 26.3% |
[ 46.5% - 47.0% ] 46.76% | 1,026,857 | 23.7% |
[ 47.0% - 47.5% ] 47.23% | 986,920 | 21.5% |
[ 47.5% - 48.0% ] 47.65% | 1,052,680 | 26.3% |
[ 48.0% - 48.5% ] 48.13% | 5,191,806 | 18.9% |
[ 48.5% - 49.0% ] 48.76% | 901,655 | 22.5% |
[ 49.0% - 49.5% ] 49.24% | 1,183,029 | 21.2% |
[ 49.5% - 50.0% ] 49.79% | 1,822,593 | 22.6% |
[ 50.0% - 50.5% ] 50.31% | 1,472,176 | 23.3% |
[ 50.5% - 51.0% ] 50.76% | 571,248 | 24.4% |
[ 51.0% - 51.5% ] 51.22% | 592,197 | 26.7% |
[ 51.5% - 52.0% ] 51.71% | 887,083 | 22.8% |
[ 52.0% - 52.5% ] 52.29% | 1,068,566 | 25.4% |
[ 52.5% - 53.0% ] 52.79% | 1,318,296 | 25.7% |
[ 53.0% - 53.5% ] 53.25% | 1,181,449 | 23.3% |
[ 53.5% - 54.0% ] 53.77% | 782,624 | 30.1% |
[ 54.0% - 54.5% ] 54.25% | 747,326 | 29.5% |
[ 54.5% - 55.0% ] 54.71% | 1,002,122 | 24.5% |
[ 55.0% - 55.5% ] 55.31% | 1,438,056 | 23.5% |
[ 55.5% - 56.0% ] 55.65% | 703,007 | 29.9% |
[ 56.0% - 56.5% ] 56.28% | 496,478 | 24.4% |
[ 56.5% - 57.0% ] 56.74% | 666,860 | 27.8% |
[ 57.0% - 57.5% ] 57.17% | 667,147 | 25.1% |
[ 57.5% - 58.0% ] 57.74% | 816,514 | 23.6% |
[ 58.0% - 58.5% ] 58.23% | 447,146 | 24.2% |
[ 58.5% - 59.0% ] 58.82% | 777,273 | 25.5% |
[ 59.0% - 59.5% ] 59.26% | 667,204 | 21.5% |
[ 59.5% - 60.0% ] 59.74% | 589,586 | 21.3% |
[ 60.0% - 60.5% ] 60.22% | 1,002,718 | 24.9% |
[ 60.5% - 61.0% ] 60.76% | 289,243 | 21.0% |
[ 61.0% - 61.5% ] 61.17% | 720,438 | 22.8% |
[ 61.5% - 62.0% ] 61.78% | 838,741 | 24.0% |
[ 62.0% - 62.5% ] 62.26% | 884,347 | 29.4% |
[ 62.5% - 63.0% ] 62.81% | 674,266 | 27.2% |
[ 63.0% - 63.5% ] 63.21% | 876,761 | 23.7% |
[ 63.5% - 64.0% ] 63.72% | 385,110 | 25.0% |
[ 64.0% - 64.5% ] 64.30% | 509,882 | 28.8% |
[ 64.5% - 65.0% ] 64.77% | 631,333 | 26.6% |
[ 65.0% - 65.5% ] 65.29% | 678,109 | 20.9% |
[ 65.5% - 66.0% ] 65.80% | 1,999,541 | 21.1% |
[ 66.0% - 66.5% ] 66.16% | 552,609 | 19.7% |
[ 66.5% - 67.0% ] 66.73% | 267,254 | 31.3% |
[ 67.0% - 67.5% ] 67.30% | 866,704 | 20.3% |
[ 67.5% - 68.0% ] 67.73% | 520,216 | 25.3% |
[ 68.0% - 68.5% ] 68.23% | 665,692 | 25.3% |
[ 68.5% - 69.0% ] 68.85% | 598,285 | 25.4% |
[ 69.0% - 69.5% ] 69.25% | 846,679 | 25.0% |
[ 69.5% - 70.0% ] 69.74% | 522,306 | 26.5% |
[ 70.0% - 70.5% ] 70.27% | 889,236 | 25.2% |
[ 70.5% - 71.0% ] 70.67% | 483,000 | 26.3% |
[ 71.0% - 71.5% ] 71.21% | 463,076 | 23.4% |
[ 71.5% - 72.0% ] 71.77% | 442,118 | 27.1% |
[ 72.0% - 72.5% ] 72.23% | 1,245,712 | 25.9% |
[ 72.5% - 73.0% ] 72.81% | 798,998 | 23.8% |
[ 73.0% - 73.5% ] 73.17% | 411,567 | 26.5% |
[ 73.5% - 74.0% ] 73.75% | 334,251 | 22.4% |
[ 74.0% - 74.5% ] 74.24% | 835,713 | 23.8% |
[ 74.5% - 75.0% ] 74.74% | 412,640 | 23.5% |
[ 75.0% - 75.5% ] 75.19% | 486,503 | 30.8% |
[ 75.5% - 76.0% ] 75.82% | 502,733 | 21.9% |
[ 76.0% - 76.5% ] 76.19% | 262,772 | 30.7% |
[ 76.5% - 77.0% ] 76.78% | 344,600 | 23.4% |
[ 77.0% - 77.5% ] 77.17% | 724,490 | 26.0% |
[ 77.5% - 78.0% ] 77.75% | 423,128 | 24.7% |
[ 78.0% - 78.5% ] 78.22% | 449,223 | 22.5% |
[ 78.5% - 79.0% ] 78.76% | 623,843 | 23.9% |
[ 79.0% - 79.5% ] 79.21% | 352,903 | 25.2% |
[ 79.5% - 80.0% ] 79.76% | 268,897 | 26.0% |
[ 80.0% - 80.5% ] 80.27% | 447,365 | 22.7% |
[ 80.5% - 81.0% ] 80.63% | 192,018 | 29.4% |
[ 81.0% - 81.5% ] 81.22% | 492,749 | 25.8% |
[ 81.5% - 82.0% ] 81.68% | 1,164,894 | 24.6% |
[ 82.0% - 82.5% ] 82.30% | 238,216 | 26.2% |
[ 82.5% - 83.0% ] 82.73% | 585,302 | 26.3% |
[ 83.0% - 83.5% ] 83.25% | 259,120 | 24.7% |
[ 83.5% - 84.0% ] 83.79% | 291,444 | 31.5% |
[ 84.0% - 84.5% ] 84.17% | 333,877 | 23.6% |
[ 84.5% - 85.0% ] 84.71% | 417,718 | 21.6% |
[ 85.0% - 85.5% ] 85.18% | 161,206 | 28.6% |
[ 85.5% - 86.0% ] 85.80% | 175,128 | 26.9% |
[ 86.0% - 86.5% ] 86.20% | 339,799 | 26.2% |
[ 86.5% - 87.0% ] 86.80% | 285,623 | 30.2% |
[ 87.0% - 87.5% ] 87.10% | 454,818 | 25.9% |
[ 87.5% - 88.0% ] 87.78% | 420,653 | 25.6% |
[ 88.0% - 88.5% ] 88.17% | 417,780 | 24.7% |
[ 88.5% - 89.0% ] 88.85% | 213,999 | 25.0% |
[ 89.0% - 89.5% ] 89.25% | 410,570 | 26.3% |
[ 89.5% - 90.0% ] 89.63% | 146,960 | 24.7% |
[ 90.0% - 90.5% ] 90.38% | 332,839 | 27.4% |
[ 91.0% - 91.5% ] 91.34% | 134,373 | 28.5% |
[ 91.5% - 92.0% ] 91.68% | 233,190 | 23.1% |
[ 92.0% - 92.5% ] 92.17% | 460,091 | 21.8% |
[ 92.5% - 93.0% ] 92.70% | 126,169 | 28.2% |
[ 93.0% - 93.5% ] 93.32% | 279,578 | 24.8% |
[ 93.5% - 94.0% ] 93.78% | 450,655 | 24.9% |
[ 94.0% - 94.5% ] 94.22% | 355,461 | 27.3% |
[ 94.5% - 95.0% ] 94.68% | 632,698 | 26.0% |
[ 95.0% - 95.5% ] 95.26% | 994,243 | 27.5% |
[ 96.0% - 96.5% ] 96.28% | 522,264 | 20.1% |
[ 97.0% - 97.5% ] 97.23% | 518,377 | 22.8% |
[ 97.5% - 98.0% ] 97.82% | 903,429 | 13.7% |
[ 98.0% - 98.5% ] 98.17% | 483,465 | 17.5% |
[ 99.5% - 100.0% ] 100.00% | 253,703 | 26.8% |