Immigrants from Latin America Wage/Income Gap
COMPARE
Immigrants from Latin America
Select to Compare
Wage/Income Gap
Immigrants from Latin America Wage/Income Gap
23.7%
WAGE/INCOME GAP
99.2/ 100
METRIC RATING
98th/ 347
METRIC RANK
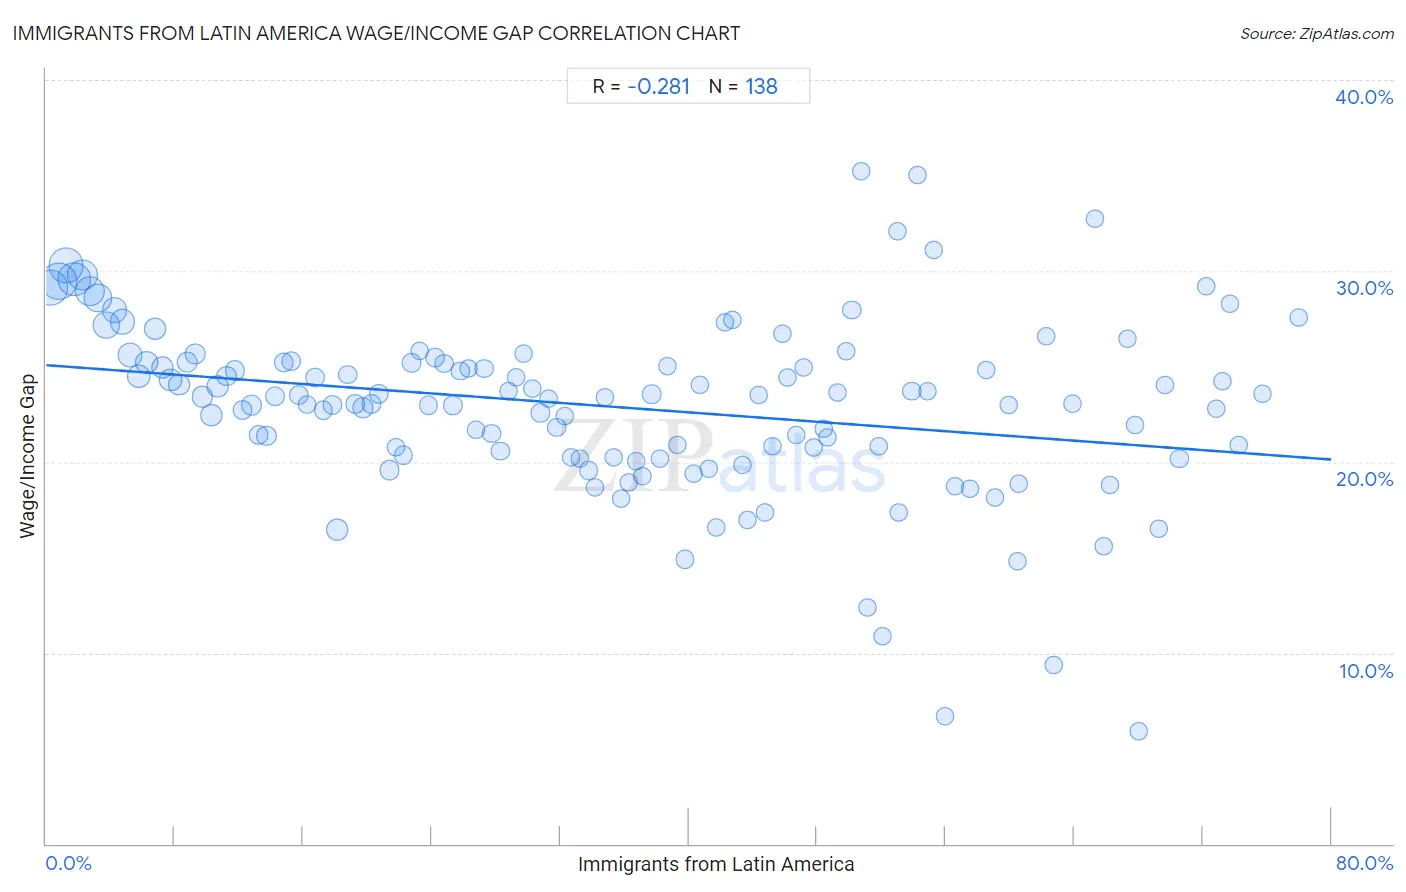
Immigrants from Latin America Wage/Income Gap Correlation Chart
The statistical analysis conducted on geographies consisting of 556,436,058 people shows a weak negative correlation between the proportion of Immigrants from Latin America and wage/income gap percentage in the United States with a correlation coefficient (R) of -0.281 and weighted average of 23.7%. On average, for every 1% (one percent) increase in Immigrants from Latin America within a typical geography, there is a decrease of 0.062% in wage/income gap percentage.
It is essential to understand that the correlation between the percentage of Immigrants from Latin America and wage/income gap percentage does not imply a direct cause-and-effect relationship. It remains uncertain whether the presence of Immigrants from Latin America influences an upward or downward trend in the level of wage/income gap percentage within an area, or if Immigrants from Latin America simply ended up residing in those areas with higher or lower levels of wage/income gap percentage due to other factors.
Demographics Similar to Immigrants from Latin America by Wage/Income Gap
In terms of wage/income gap, the demographic groups most similar to Immigrants from Latin America are Aleut (23.7%, a difference of 0.070%), Yakama (23.7%, a difference of 0.090%), Japanese (23.8%, a difference of 0.25%), Immigrants from Laos (23.8%, a difference of 0.39%), and Immigrants from Sudan (23.6%, a difference of 0.40%).
| Demographics | Rating | Rank | Wage/Income Gap |
| Arapaho | 99.6 /100 | #91 | Exceptional 23.5% |
| Immigrants from Honduras | 99.5 /100 | #92 | Exceptional 23.5% |
| Immigrants from Cabo Verde | 99.5 /100 | #93 | Exceptional 23.6% |
| Hondurans | 99.5 /100 | #94 | Exceptional 23.6% |
| Cape Verdeans | 99.4 /100 | #95 | Exceptional 23.6% |
| Kiowa | 99.4 /100 | #96 | Exceptional 23.6% |
| Immigrants from Sudan | 99.4 /100 | #97 | Exceptional 23.6% |
| Immigrants from Latin America | 99.2 /100 | #98 | Exceptional 23.7% |
| Aleuts | 99.2 /100 | #99 | Exceptional 23.7% |
| Yakama | 99.2 /100 | #100 | Exceptional 23.7% |
| Japanese | 99.1 /100 | #101 | Exceptional 23.8% |
| Immigrants from Laos | 99.0 /100 | #102 | Exceptional 23.8% |
| Tsimshian | 98.9 /100 | #103 | Exceptional 23.9% |
| Tlingit-Haida | 98.7 /100 | #104 | Exceptional 24.0% |
| Moroccans | 98.6 /100 | #105 | Exceptional 24.0% |
Immigrants from Latin America Wage/Income Gap Correlation Summary
| Measurement | Immigrants from Latin America Data | Wage/Income Gap Data |
| Minimum | 0.27% | 5.9% |
| Maximum | 78.0% | 35.2% |
| Range | 77.7% | 29.3% |
| Mean | 35.3% | 22.9% |
| Median | 34.5% | 23.4% |
| Interquartile 25% (IQ1) | 17.2% | 20.4% |
| Interquartile 75% (IQ3) | 51.8% | 25.2% |
| Interquartile Range (IQR) | 34.6% | 4.8% |
| Standard Deviation (Sample) | 21.2% | 4.7% |
| Standard Deviation (Population) | 21.1% | 4.6% |
Correlation Details
| Immigrants from Latin America Percentile | Sample Size | Wage/Income Gap |
[ 0.0% - 0.5% ] 0.27% | 45,043,779 | 29.1% |
[ 0.5% - 1.0% ] 0.75% | 48,602,198 | 29.5% |
[ 1.0% - 1.5% ] 1.24% | 42,936,810 | 30.3% |
[ 1.5% - 2.0% ] 1.75% | 36,378,074 | 29.6% |
[ 2.0% - 2.5% ] 2.25% | 32,571,950 | 29.8% |
[ 2.5% - 3.0% ] 2.75% | 29,387,619 | 28.9% |
[ 3.0% - 3.5% ] 3.22% | 23,746,637 | 28.6% |
[ 3.5% - 4.0% ] 3.75% | 22,299,714 | 27.1% |
[ 4.0% - 4.5% ] 4.25% | 18,535,648 | 28.0% |
[ 4.5% - 5.0% ] 4.75% | 16,730,427 | 27.3% |
[ 5.0% - 5.5% ] 5.23% | 16,061,923 | 25.6% |
[ 5.5% - 6.0% ] 5.74% | 12,972,068 | 24.5% |
[ 6.0% - 6.5% ] 6.24% | 10,793,098 | 25.2% |
[ 6.5% - 7.0% ] 6.74% | 9,527,697 | 26.9% |
[ 7.0% - 7.5% ] 7.24% | 10,017,585 | 25.0% |
[ 7.5% - 8.0% ] 7.74% | 10,106,585 | 24.3% |
[ 8.0% - 8.5% ] 8.26% | 8,079,095 | 24.0% |
[ 8.5% - 9.0% ] 8.77% | 8,025,461 | 25.2% |
[ 9.0% - 9.5% ] 9.25% | 5,414,228 | 25.7% |
[ 9.5% - 10.0% ] 9.71% | 7,206,435 | 23.4% |
[ 10.0% - 10.5% ] 10.29% | 8,814,717 | 22.5% |
[ 10.5% - 11.0% ] 10.68% | 8,916,624 | 24.0% |
[ 11.0% - 11.5% ] 11.23% | 4,316,132 | 24.5% |
[ 11.5% - 12.0% ] 11.77% | 3,777,173 | 24.8% |
[ 12.0% - 12.5% ] 12.23% | 3,104,006 | 22.7% |
[ 12.5% - 13.0% ] 12.77% | 5,390,389 | 23.0% |
[ 13.0% - 13.5% ] 13.25% | 3,824,861 | 21.4% |
[ 13.5% - 14.0% ] 13.70% | 5,385,644 | 21.4% |
[ 14.0% - 14.5% ] 14.25% | 2,787,708 | 23.4% |
[ 14.5% - 15.0% ] 14.77% | 3,180,000 | 25.2% |
[ 15.0% - 15.5% ] 15.26% | 3,401,898 | 25.3% |
[ 15.5% - 16.0% ] 15.72% | 2,906,516 | 23.5% |
[ 16.0% - 16.5% ] 16.24% | 2,139,734 | 23.0% |
[ 16.5% - 17.0% ] 16.74% | 2,942,950 | 24.4% |
[ 17.0% - 17.5% ] 17.24% | 2,141,054 | 22.7% |
[ 17.5% - 18.0% ] 17.80% | 3,366,440 | 23.0% |
[ 18.0% - 18.5% ] 18.12% | 11,260,003 | 16.5% |
[ 18.5% - 19.0% ] 18.78% | 2,072,361 | 24.6% |
[ 19.0% - 19.5% ] 19.24% | 2,205,251 | 23.0% |
[ 19.5% - 20.0% ] 19.71% | 4,709,567 | 22.8% |
[ 20.0% - 20.5% ] 20.25% | 2,021,489 | 23.0% |
[ 20.5% - 21.0% ] 20.71% | 2,717,670 | 23.5% |
[ 21.0% - 21.5% ] 21.37% | 5,955,542 | 19.6% |
[ 21.5% - 22.0% ] 21.77% | 1,381,164 | 20.8% |
[ 22.0% - 22.5% ] 22.24% | 2,011,362 | 20.4% |
[ 22.5% - 23.0% ] 22.74% | 1,575,155 | 25.2% |
[ 23.0% - 23.5% ] 23.24% | 1,821,508 | 25.8% |
[ 23.5% - 24.0% ] 23.78% | 1,493,631 | 23.0% |
[ 24.0% - 24.5% ] 24.24% | 2,963,926 | 25.5% |
[ 24.5% - 25.0% ] 24.76% | 1,184,146 | 25.2% |
[ 25.0% - 25.5% ] 25.31% | 1,251,882 | 23.0% |
[ 25.5% - 26.0% ] 25.77% | 1,399,776 | 24.8% |
[ 26.0% - 26.5% ] 26.30% | 1,355,551 | 24.9% |
[ 26.5% - 27.0% ] 26.73% | 1,217,476 | 21.7% |
[ 27.0% - 27.5% ] 27.25% | 1,198,081 | 24.9% |
[ 27.5% - 28.0% ] 27.73% | 1,383,056 | 21.5% |
[ 28.0% - 28.5% ] 28.29% | 1,051,970 | 20.6% |
[ 28.5% - 29.0% ] 28.79% | 958,473 | 23.7% |
[ 29.0% - 29.5% ] 29.27% | 832,524 | 24.4% |
[ 29.5% - 30.0% ] 29.74% | 774,698 | 25.7% |
[ 30.0% - 30.5% ] 30.25% | 873,833 | 23.8% |
[ 30.5% - 31.0% ] 30.76% | 1,335,327 | 22.6% |
[ 31.0% - 31.5% ] 31.26% | 833,995 | 23.3% |
[ 31.5% - 32.0% ] 31.78% | 763,844 | 21.8% |
[ 32.0% - 32.5% ] 32.30% | 1,087,197 | 22.4% |
[ 32.5% - 33.0% ] 32.70% | 849,204 | 20.2% |
[ 33.0% - 33.5% ] 33.25% | 673,238 | 20.2% |
[ 33.5% - 34.0% ] 33.75% | 621,633 | 19.5% |
[ 34.0% - 34.5% ] 34.19% | 357,712 | 18.6% |
[ 34.5% - 35.0% ] 34.77% | 710,532 | 23.4% |
[ 35.0% - 35.5% ] 35.31% | 501,484 | 20.2% |
[ 35.5% - 36.0% ] 35.81% | 726,309 | 18.1% |
[ 36.0% - 36.5% ] 36.23% | 319,576 | 18.9% |
[ 36.5% - 37.0% ] 36.71% | 448,851 | 20.0% |
[ 37.0% - 37.5% ] 37.13% | 504,518 | 19.3% |
[ 37.5% - 38.0% ] 37.70% | 692,192 | 23.5% |
[ 38.0% - 38.5% ] 38.22% | 501,352 | 20.2% |
[ 38.5% - 39.0% ] 38.69% | 507,963 | 25.0% |
[ 39.0% - 39.5% ] 39.27% | 289,435 | 20.9% |
[ 39.5% - 40.0% ] 39.77% | 409,720 | 14.9% |
[ 40.0% - 40.5% ] 40.27% | 519,976 | 19.4% |
[ 40.5% - 41.0% ] 40.67% | 733,062 | 24.0% |
[ 41.0% - 41.5% ] 41.21% | 179,869 | 19.6% |
[ 41.5% - 42.0% ] 41.73% | 166,450 | 16.6% |
[ 42.0% - 42.5% ] 42.24% | 434,212 | 27.3% |
[ 42.5% - 43.0% ] 42.73% | 420,512 | 27.5% |
[ 43.0% - 43.5% ] 43.31% | 237,489 | 19.9% |
[ 43.5% - 44.0% ] 43.69% | 205,849 | 17.0% |
[ 44.0% - 44.5% ] 44.34% | 327,025 | 23.5% |
[ 44.5% - 45.0% ] 44.72% | 288,389 | 17.3% |
[ 45.0% - 45.5% ] 45.25% | 120,622 | 20.8% |
[ 45.5% - 46.0% ] 45.85% | 173,033 | 26.7% |
[ 46.0% - 46.5% ] 46.17% | 107,006 | 24.4% |
[ 46.5% - 47.0% ] 46.72% | 222,598 | 21.4% |
[ 47.0% - 47.5% ] 47.16% | 201,590 | 24.9% |
[ 47.5% - 48.0% ] 47.81% | 157,334 | 20.7% |
[ 48.0% - 48.5% ] 48.38% | 48,752 | 21.7% |
[ 48.5% - 49.0% ] 48.65% | 270,574 | 21.3% |
[ 49.0% - 49.5% ] 49.22% | 96,524 | 23.6% |
[ 49.5% - 50.0% ] 49.81% | 248,524 | 25.8% |
[ 50.0% - 50.5% ] 50.15% | 86,921 | 28.0% |
[ 50.5% - 51.0% ] 50.72% | 111,589 | 35.2% |
[ 51.0% - 51.5% ] 51.11% | 21,106 | 12.3% |
[ 51.5% - 52.0% ] 51.81% | 133,320 | 20.8% |
[ 52.0% - 52.5% ] 52.07% | 45,438 | 10.9% |
[ 52.5% - 53.0% ] 52.98% | 13,877 | 32.1% |
[ 53.0% - 53.5% ] 53.10% | 54,558 | 17.4% |
[ 53.5% - 54.0% ] 53.89% | 443,665 | 23.7% |
[ 54.0% - 54.5% ] 54.26% | 33,642 | 35.0% |
[ 54.5% - 55.0% ] 54.90% | 37,977 | 23.7% |
[ 55.0% - 55.5% ] 55.24% | 13,787 | 31.1% |
[ 55.5% - 56.0% ] 55.93% | 55,604 | 6.7% |
[ 56.5% - 57.0% ] 56.59% | 68,517 | 18.7% |
[ 57.0% - 57.5% ] 57.49% | 7,104 | 18.6% |
[ 58.0% - 58.5% ] 58.49% | 25,151 | 24.8% |
[ 59.0% - 59.5% ] 59.08% | 51,088 | 18.2% |
[ 59.5% - 60.0% ] 59.91% | 95,616 | 23.0% |
[ 60.0% - 60.5% ] 60.45% | 24,597 | 14.8% |
[ 60.5% - 61.0% ] 60.52% | 83,491 | 18.8% |
[ 62.0% - 62.5% ] 62.24% | 107,902 | 26.6% |
[ 62.5% - 63.0% ] 62.73% | 14,911 | 9.4% |
[ 63.5% - 64.0% ] 63.90% | 167,031 | 23.0% |
[ 65.0% - 65.5% ] 65.32% | 109,226 | 32.7% |
[ 65.5% - 66.0% ] 65.81% | 52,851 | 15.6% |
[ 66.0% - 66.5% ] 66.26% | 44,595 | 18.8% |
[ 67.0% - 67.5% ] 67.28% | 40,278 | 26.5% |
[ 67.5% - 68.0% ] 67.74% | 54,873 | 22.0% |
[ 68.0% - 68.5% ] 68.02% | 20,850 | 5.9% |
[ 69.0% - 69.5% ] 69.27% | 26,596 | 16.5% |
[ 69.5% - 70.0% ] 69.67% | 57,066 | 24.0% |
[ 70.5% - 71.0% ] 70.54% | 68,435 | 20.2% |
[ 72.0% - 72.5% ] 72.20% | 19,399 | 29.2% |
[ 72.5% - 73.0% ] 72.82% | 64,572 | 22.8% |
[ 73.0% - 73.5% ] 73.24% | 222,996 | 24.2% |
[ 73.5% - 74.0% ] 73.72% | 46,798 | 28.3% |
[ 74.0% - 74.5% ] 74.26% | 71,088 | 20.9% |
[ 75.5% - 76.0% ] 75.74% | 1,018 | 23.6% |
[ 78.0% - 78.5% ] 78.01% | 42,081 | 27.6% |