Immigrants from Venezuela 2 or more Vehicles in Household
COMPARE
Immigrants from Venezuela
Select to Compare
2 or more Vehicles in Household
Immigrants from Venezuela 2 or more Vehicles in Household
55.8%
2+ VEHICLES AVAILABLE
70.7/ 100
METRIC RATING
155th/ 347
METRIC RANK
Immigrants from Venezuela 2 or more Vehicles in Household Correlation Chart
The statistical analysis conducted on geographies consisting of 287,795,975 people shows a poor positive correlation between the proportion of Immigrants from Venezuela and percentage of households with 2 or more vehicles available in the United States with a correlation coefficient (R) of 0.109 and weighted average of 55.8%. On average, for every 1% (one percent) increase in Immigrants from Venezuela within a typical geography, there is an increase of 0.19% in percentage of households with 2 or more vehicles available.
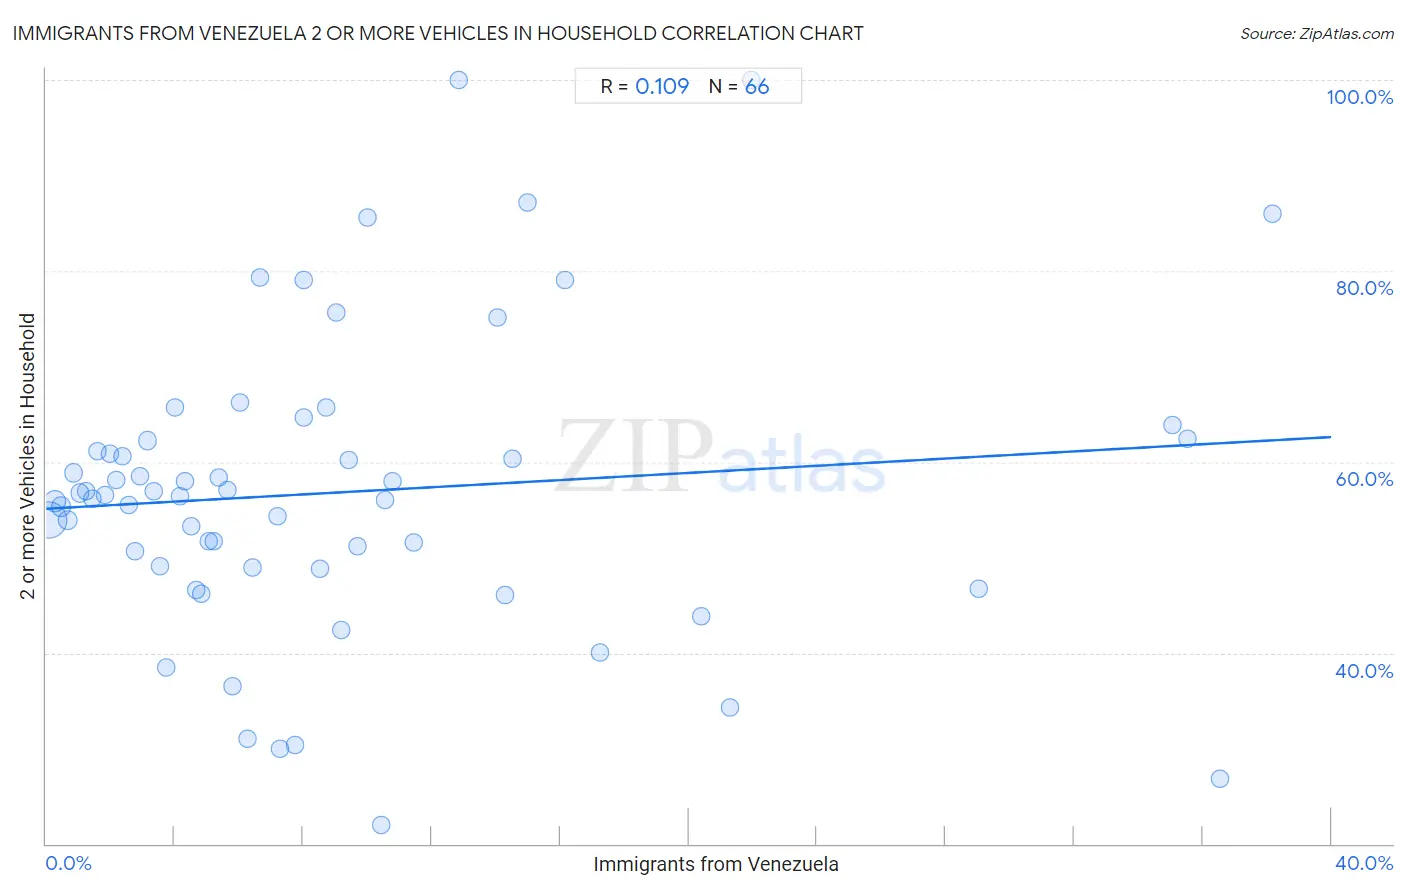
It is essential to understand that the correlation between the percentage of Immigrants from Venezuela and percentage of households with 2 or more vehicles available does not imply a direct cause-and-effect relationship. It remains uncertain whether the presence of Immigrants from Venezuela influences an upward or downward trend in the level of percentage of households with 2 or more vehicles available within an area, or if Immigrants from Venezuela simply ended up residing in those areas with higher or lower levels of percentage of households with 2 or more vehicles available due to other factors.
Demographics Similar to Immigrants from Venezuela by 2 or more Vehicles in Household
In terms of 2 or more vehicles in household, the demographic groups most similar to Immigrants from Venezuela are Ukrainian (55.8%, a difference of 0.0%), Immigrants from Lithuania (55.8%, a difference of 0.010%), Immigrants from Kuwait (55.8%, a difference of 0.030%), Lumbee (55.9%, a difference of 0.060%), and Tlingit-Haida (55.8%, a difference of 0.10%).
| Demographics | Rating | Rank | 2 or more Vehicles in Household |
| Immigrants from Moldova | 80.2 /100 | #148 | Excellent 56.1% |
| Chileans | 80.2 /100 | #149 | Excellent 56.1% |
| Nicaraguans | 79.9 /100 | #150 | Good 56.1% |
| Immigrants from Northern Europe | 78.7 /100 | #151 | Good 56.1% |
| Immigrants from Pakistan | 78.1 /100 | #152 | Good 56.1% |
| Lumbee | 71.9 /100 | #153 | Good 55.9% |
| Ukrainians | 70.8 /100 | #154 | Good 55.8% |
| Immigrants from Venezuela | 70.7 /100 | #155 | Good 55.8% |
| Immigrants from Lithuania | 70.4 /100 | #156 | Good 55.8% |
| Immigrants from Kuwait | 70.2 /100 | #157 | Good 55.8% |
| Tlingit-Haida | 68.5 /100 | #158 | Good 55.8% |
| Paiute | 68.0 /100 | #159 | Good 55.8% |
| Crow | 67.0 /100 | #160 | Good 55.7% |
| Colville | 61.1 /100 | #161 | Good 55.6% |
| German Russians | 60.9 /100 | #162 | Good 55.6% |
Immigrants from Venezuela 2 or more Vehicles in Household Correlation Summary
| Measurement | Immigrants from Venezuela Data | 2 or more Vehicles in Household Data |
| Minimum | 0.077% | 22.0% |
| Maximum | 38.2% | 100.0% |
| Range | 38.1% | 78.0% |
| Mean | 9.2% | 56.8% |
| Median | 6.3% | 56.4% |
| Interquartile 25% (IQ1) | 3.1% | 49.0% |
| Interquartile 75% (IQ3) | 10.8% | 62.2% |
| Interquartile Range (IQR) | 7.6% | 13.3% |
| Standard Deviation (Sample) | 9.1% | 15.7% |
| Standard Deviation (Population) | 9.0% | 15.5% |
Correlation Details
| Immigrants from Venezuela Percentile | Sample Size | 2 or more Vehicles in Household |
[ 0.0% - 0.5% ] 0.077% | 198,524,087 | 53.9% |
[ 0.0% - 0.5% ] 0.27% | 40,775,169 | 55.9% |
[ 0.0% - 0.5% ] 0.46% | 16,510,792 | 55.3% |
[ 0.5% - 1.0% ] 0.67% | 9,334,189 | 53.9% |
[ 0.5% - 1.0% ] 0.85% | 4,948,313 | 58.8% |
[ 1.0% - 1.5% ] 1.03% | 2,695,417 | 56.7% |
[ 1.0% - 1.5% ] 1.24% | 2,633,329 | 56.9% |
[ 1.0% - 1.5% ] 1.43% | 1,753,051 | 56.1% |
[ 1.5% - 2.0% ] 1.61% | 1,066,257 | 61.1% |
[ 1.5% - 2.0% ] 1.84% | 693,979 | 56.5% |
[ 1.5% - 2.0% ] 2.00% | 1,555,936 | 60.9% |
[ 2.0% - 2.5% ] 2.18% | 304,093 | 58.1% |
[ 2.0% - 2.5% ] 2.36% | 750,791 | 60.5% |
[ 2.5% - 3.0% ] 2.56% | 529,146 | 55.5% |
[ 2.5% - 3.0% ] 2.77% | 321,337 | 50.6% |
[ 2.5% - 3.0% ] 2.94% | 250,754 | 58.5% |
[ 3.0% - 3.5% ] 3.14% | 366,617 | 62.2% |
[ 3.0% - 3.5% ] 3.33% | 430,339 | 56.9% |
[ 3.5% - 4.0% ] 3.55% | 655,448 | 49.1% |
[ 3.5% - 4.0% ] 3.72% | 594,852 | 38.5% |
[ 3.5% - 4.0% ] 3.99% | 96,877 | 65.6% |
[ 4.0% - 4.5% ] 4.15% | 434,328 | 56.3% |
[ 4.0% - 4.5% ] 4.30% | 352,083 | 58.0% |
[ 4.5% - 5.0% ] 4.52% | 196,179 | 53.3% |
[ 4.5% - 5.0% ] 4.68% | 133,624 | 46.6% |
[ 4.5% - 5.0% ] 4.82% | 240,211 | 46.1% |
[ 5.0% - 5.5% ] 5.05% | 119,732 | 51.7% |
[ 5.0% - 5.5% ] 5.22% | 50,797 | 51.6% |
[ 5.0% - 5.5% ] 5.36% | 95,081 | 58.4% |
[ 5.5% - 6.0% ] 5.65% | 146,976 | 57.1% |
[ 5.5% - 6.0% ] 5.81% | 15,184 | 36.5% |
[ 6.0% - 6.5% ] 6.02% | 240,424 | 66.2% |
[ 6.0% - 6.5% ] 6.26% | 22,202 | 31.0% |
[ 6.0% - 6.5% ] 6.41% | 79,823 | 49.0% |
[ 6.5% - 7.0% ] 6.65% | 27,228 | 79.3% |
[ 7.0% - 7.5% ] 7.19% | 56,589 | 54.3% |
[ 7.0% - 7.5% ] 7.27% | 25,283 | 29.9% |
[ 7.5% - 8.0% ] 7.72% | 22,475 | 30.3% |
[ 8.0% - 8.5% ] 8.00% | 19,895 | 64.6% |
[ 8.0% - 8.5% ] 8.02% | 212 | 79.0% |
[ 8.5% - 9.0% ] 8.53% | 49,068 | 48.8% |
[ 8.5% - 9.0% ] 8.73% | 51,142 | 65.8% |
[ 9.0% - 9.5% ] 9.01% | 222 | 75.6% |
[ 9.0% - 9.5% ] 9.16% | 14,557 | 42.4% |
[ 9.0% - 9.5% ] 9.43% | 2,419 | 60.2% |
[ 9.5% - 10.0% ] 9.70% | 78,478 | 51.2% |
[ 10.0% - 10.5% ] 10.01% | 23,734 | 85.6% |
[ 10.0% - 10.5% ] 10.44% | 22,540 | 22.0% |
[ 10.5% - 11.0% ] 10.53% | 66,299 | 56.0% |
[ 10.5% - 11.0% ] 10.78% | 57,150 | 57.9% |
[ 11.0% - 11.5% ] 11.46% | 20,034 | 51.5% |
[ 12.5% - 13.0% ] 12.86% | 70 | 100.0% |
[ 14.0% - 14.5% ] 14.06% | 68,029 | 75.2% |
[ 14.0% - 14.5% ] 14.26% | 54,464 | 46.1% |
[ 14.5% - 15.0% ] 14.53% | 57,878 | 60.3% |
[ 14.5% - 15.0% ] 14.96% | 548 | 87.2% |
[ 16.0% - 16.5% ] 16.13% | 11,809 | 79.1% |
[ 17.0% - 17.5% ] 17.23% | 383 | 40.0% |
[ 20.0% - 20.5% ] 20.40% | 5,843 | 43.8% |
[ 21.0% - 21.5% ] 21.29% | 155 | 34.2% |
[ 21.5% - 22.0% ] 21.95% | 41 | 100.0% |
[ 29.0% - 29.5% ] 29.04% | 1,873 | 46.7% |
[ 35.0% - 35.5% ] 35.06% | 64,751 | 63.9% |
[ 35.5% - 36.0% ] 35.53% | 74,891 | 62.4% |
[ 36.5% - 37.0% ] 36.55% | 249 | 26.8% |
[ 38.0% - 38.5% ] 38.15% | 249 | 86.0% |