Immigrants from Venezuela Disability Age Under 5

COMPARE

Immigrants from Venezuela
Race
Ancestry
AfghanAfricanAlaska NativeAlaskan AthabascanAlbanianAleutAlsatianAmericanApacheArabArapahoArgentineanArmenianAssyrian/Chaldean/SyriacAustralianAustrianBahamianBangladeshiBarbadianBasqueBelgianBelizeanBermudanBhutaneseBlackfeetBolivianBrazilianBritishBritish West IndianBulgarianBurmeseCajunCambodianCanadianCape VerdeanCarpatho RusynCelticCentral AmericanCentral American IndianCherokeeCheyenneChickasawChileanChineseChippewaChoctawColombianColvilleComancheCosta RicanCreeCreekCroatianCrowCubanCypriotCzechCzechoslovakianDanishDelawareDominicanDutchDutch West IndianEastern EuropeanEcuadorianEgyptianEnglishEstonianEthiopianEuropeanFijianFilipinoFinnishFrenchFrench American IndianFrench CanadianGermanGerman RussianGhanaianGreekGuamanian/ChamorroGuatemalanGuyaneseHaitianHmongHonduranHopiHoumaHungarianIcelanderIndian (Asian)IndonesianInupiatIranianIraqiIrishIroquoisIsraeliItalianJamaicanJapaneseJordanianKenyanKiowaKoreanLaotianLatvianLebaneseLiberianLithuanianLumbeeLuxembourgerMacedonianMalaysianMalteseMarshalleseMenomineeMexicanMexican American IndianMongolianMoroccanNative HawaiianNavajoNepaleseNew ZealanderNicaraguanNigerianNorthern EuropeanNorwegianOkinawanOsageOttawaPaiutePakistaniPalestinianPanamanianParaguayanPennsylvania GermanPeruvianPimaPolishPortuguesePotawatomiPuebloPuerto RicanPuget Sound SalishRomanianRussianSalvadoranSamoanScandinavianScotch-IrishScottishSeminoleSenegaleseSerbianShoshoneSierra LeoneanSiouxSlavicSlovakSloveneSomaliSouth AfricanSouth AmericanSouth American IndianSoviet UnionSpaniardSpanishSpanish AmericanSpanish American IndianSri LankanSubsaharan AfricanSudaneseSwedishSwissSyrianTaiwaneseThaiTlingit-HaidaTohono O'OdhamTonganTrinidadian and TobagonianTsimshianTurkishU.S. Virgin IslanderUgandanUkrainianUruguayanUteVenezuelanVietnameseWelshWest IndianYakamaYaquiYugoslavianYumanYup'ikZimbabwean
Immigration
NonimmigrantsImmigrantsAfghanistanAfricaAlbaniaArgentinaArmeniaAsiaAustraliaAustriaBahamasBangladeshBarbadosBelarusBelgiumBelizeBoliviaBosnia and HerzegovinaBrazilBulgariaBurma/MyanmarCabo VerdeCambodiaCameroonCanadaCaribbeanCentral AmericaChileChinaColombiaCongoCosta RicaCroatiaCubaCzechoslovakiaDenmarkDominicaDominican RepublicEastern AfricaEastern AsiaEastern EuropeEcuadorEgyptEl SalvadorEnglandEritreaEthiopiaEuropeFijiFranceGermanyGhanaGreeceGrenadaGuatemalaGuyanaHaitiHondurasHong KongHungaryIndiaIndonesiaIranIraqIrelandIsraelItalyJamaicaJapanJordanKazakhstanKenyaKoreaKuwaitLaosLatin AmericaLatviaLebanonLiberiaLithuaniaMalaysiaMexicoMicronesiaMiddle AfricaMoldovaMoroccoNepalNetherlandsNicaraguaNigeriaNorth AmericaNorth MacedoniaNorthern AfricaNorthern EuropeNorwayOceaniaPakistanPanamaPeruPhilippinesPolandPortugalRomaniaRussiaSaudi ArabiaScotlandSenegalSerbiaSierra LeoneSingaporeSomaliaSouth AfricaSouth AmericaSouth Central AsiaSouth Eastern AsiaSouthern EuropeSpainSri LankaSt. Vincent and the GrenadinesSudanSwedenSwitzerlandSyriaTaiwanThailandTrinidad and TobagoTurkeyUgandaUkraineUruguayUzbekistanVenezuelaVietnamWest IndiesWestern AfricaWestern AsiaWestern EuropeYemenZaireZimbabweAzores
Select to Compare
Race
Ancestry
AfghanAfricanAlaska NativeAlaskan AthabascanAlbanianAleutAlsatianAmericanApacheArabArapahoArgentineanArmenianAssyrian/Chaldean/SyriacAustralianAustrianBahamianBangladeshiBarbadianBasqueBelgianBelizeanBermudanBhutaneseBlackfeetBolivianBrazilianBritishBritish West IndianBulgarianBurmeseCajunCambodianCanadianCape VerdeanCarpatho RusynCelticCentral AmericanCentral American IndianCherokeeCheyenneChickasawChileanChineseChippewaChoctawColombianColvilleComancheCosta RicanCreeCreekCroatianCrowCubanCypriotCzechCzechoslovakianDanishDelawareDominicanDutchDutch West IndianEastern EuropeanEcuadorianEgyptianEnglishEstonianEthiopianEuropeanFijianFilipinoFinnishFrenchFrench American IndianFrench CanadianGermanGerman RussianGhanaianGreekGuamanian/ChamorroGuatemalanGuyaneseHaitianHmongHonduranHopiHoumaHungarianIcelanderIndian (Asian)IndonesianInupiatIranianIraqiIrishIroquoisIsraeliItalianJamaicanJapaneseJordanianKenyanKiowaKoreanLaotianLatvianLebaneseLiberianLithuanianLumbeeLuxembourgerMacedonianMalaysianMalteseMarshalleseMenomineeMexicanMexican American IndianMongolianMoroccanNative HawaiianNavajoNepaleseNew ZealanderNicaraguanNigerianNorthern EuropeanNorwegianOkinawanOsageOttawaPaiutePakistaniPalestinianPanamanianParaguayanPennsylvania GermanPeruvianPimaPolishPortuguesePotawatomiPuebloPuerto RicanPuget Sound SalishRomanianRussianSalvadoranSamoanScandinavianScotch-IrishScottishSeminoleSenegaleseSerbianShoshoneSierra LeoneanSiouxSlavicSlovakSloveneSomaliSouth AfricanSouth AmericanSouth American IndianSoviet UnionSpaniardSpanishSpanish AmericanSpanish American IndianSri LankanSubsaharan AfricanSudaneseSwedishSwissSyrianTaiwaneseThaiTlingit-HaidaTohono O'OdhamTonganTrinidadian and TobagonianTsimshianTurkishU.S. Virgin IslanderUgandanUkrainianUruguayanUteVenezuelanVietnameseWelshWest IndianYakamaYaquiYugoslavianYumanYup'ikZimbabwean
Immigration
NonimmigrantsImmigrantsAfghanistanAfricaAlbaniaArgentinaArmeniaAsiaAustraliaAustriaBahamasBangladeshBarbadosBelarusBelgiumBelizeBoliviaBosnia and HerzegovinaBrazilBulgariaBurma/MyanmarCabo VerdeCambodiaCameroonCanadaCaribbeanCentral AmericaChileChinaColombiaCongoCosta RicaCroatiaCubaCzechoslovakiaDenmarkDominicaDominican RepublicEastern AfricaEastern AsiaEastern EuropeEcuadorEgyptEl SalvadorEnglandEritreaEthiopiaEuropeFijiFranceGermanyGhanaGreeceGrenadaGuatemalaGuyanaHaitiHondurasHong KongHungaryIndiaIndonesiaIranIraqIrelandIsraelItalyJamaicaJapanJordanKazakhstanKenyaKoreaKuwaitLaosLatin AmericaLatviaLebanonLiberiaLithuaniaMalaysiaMexicoMicronesiaMiddle AfricaMoldovaMoroccoNepalNetherlandsNicaraguaNigeriaNorth AmericaNorth MacedoniaNorthern AfricaNorthern EuropeNorwayOceaniaPakistanPanamaPeruPhilippinesPolandPortugalRomaniaRussiaSaudi ArabiaScotlandSenegalSerbiaSierra LeoneSingaporeSomaliaSouth AfricaSouth AmericaSouth Central AsiaSouth Eastern AsiaSouthern EuropeSpainSri LankaSt. Vincent and the GrenadinesSudanSwedenSwitzerlandSyriaTaiwanThailandTrinidad and TobagoTurkeyUgandaUkraineUruguayUzbekistanVietnamWest IndiesWestern AfricaWestern AsiaWestern EuropeYemenZaireZimbabweAzores
Disability Age Under 5
Income
Poverty
Unemployment
Labor Participation
Family Structure
Vehicle Availability
Education Level
Disability

Immigrants from Venezuela Disability Age Under 5
Exceptional

1.2%
DISABILITY | AGE UNDER 5
93.4/ 100
METRIC RATING
118th/ 347
METRIC RANK

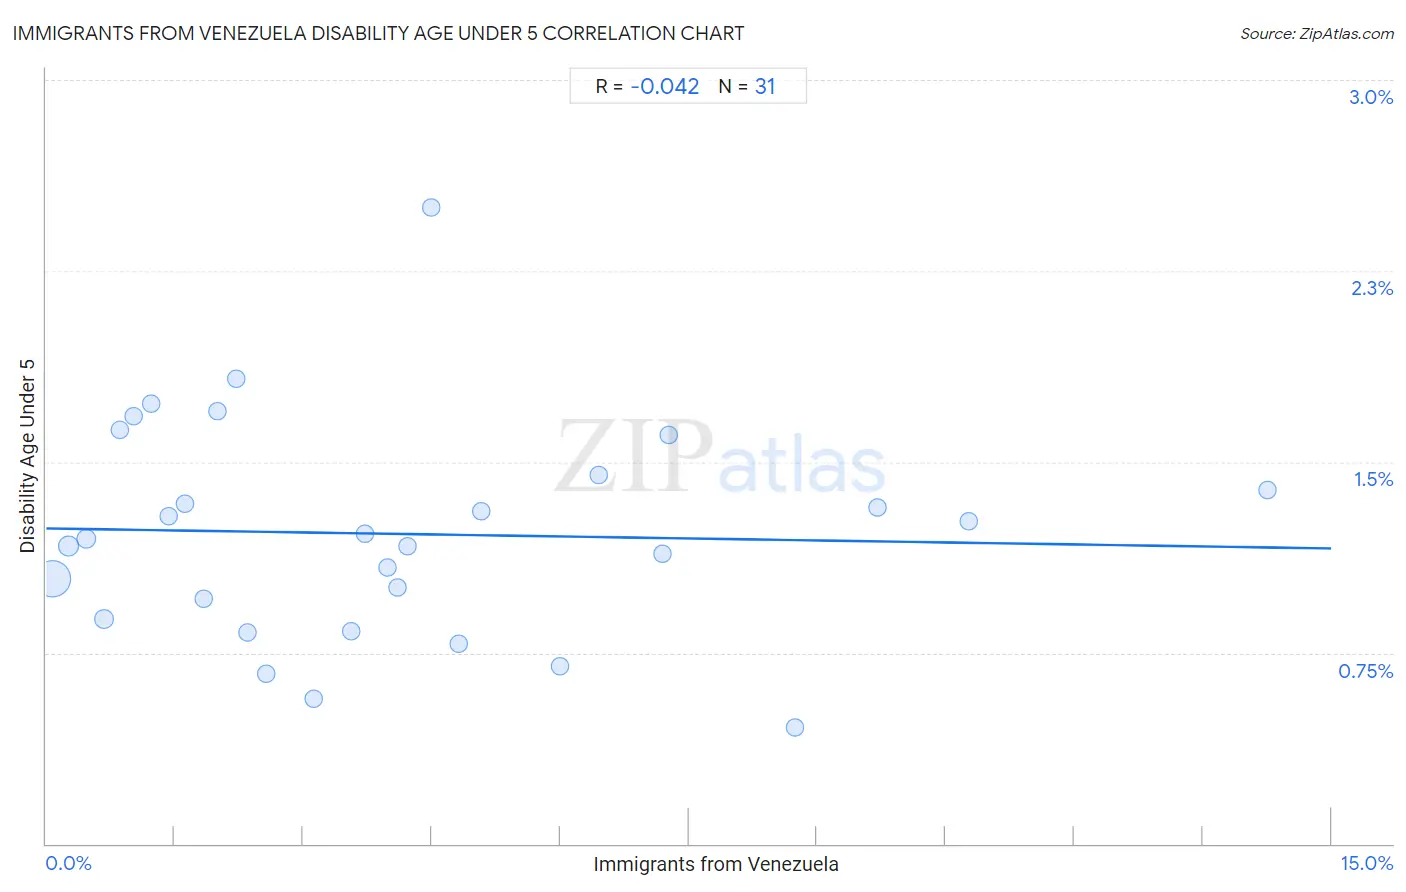
Immigrants from Venezuela Disability Age Under 5 Correlation Chart

The statistical analysis conducted on geographies consisting of 173,759,637 people shows no correlation between the proportion of Immigrants from Venezuela and percentage of population with a disability under the age of 5 in the United States with a correlation coefficient (R) of -0.042 and weighted average of 1.2%. On average, for every 1% (one percent) increase in Immigrants from Venezuela within a typical geography, there is a decrease of 0.0052% in percentage of population with a disability under the age of 5.
Immigrants from Venezuela Disability Age Under 5
It is essential to understand that the correlation between the percentage of Immigrants from Venezuela and percentage of population with a disability under the age of 5 does not imply a direct cause-and-effect relationship. It remains uncertain whether the presence of Immigrants from Venezuela influences an upward or downward trend in the level of percentage of population with a disability under the age of 5 within an area, or if Immigrants from Venezuela simply ended up residing in those areas with higher or lower levels of percentage of population with a disability under the age of 5 due to other factors.

Demographics Similar to Immigrants from Venezuela by Disability Age Under 5

In terms of disability age under 5, the demographic groups most similar to Immigrants from Venezuela are Immigrants from Philippines (1.2%, a difference of 0.030%), Immigrants from Northern Africa (1.2%, a difference of 0.17%), Immigrants from Caribbean (1.2%, a difference of 0.19%), Belizean (1.2%, a difference of 0.20%), and Bhutanese (1.2%, a difference of 0.34%).
DemographicsRating | RankDisability Age Under 5
Senegalese
94.6
/100
|
#111
Exceptional
1.2%
Immigrants from Australia
94.4
/100
|
#112
Exceptional
1.2%
Immigrants from Oceania
94.2
/100
|
#113
Exceptional
1.2%
Belizeans
93.9
/100
|
#114
Exceptional
1.2%
Immigrants from Caribbean
93.8
/100
|
#115
Exceptional
1.2%
Immigrants from Northern Africa
93.8
/100
|
#116
Exceptional
1.2%
Immigrants from Philippines
93.5
/100
|
#117
Exceptional
1.2%
Immigrants from Venezuela
93.4
/100
|
#118
Exceptional
1.2%
Bhutanese
92.5
/100
|
#119
Exceptional
1.2%
Immigrants from Eritrea
92.3
/100
|
#120
Exceptional
1.2%
Immigrants from Senegal
91.4
/100
|
#121
Exceptional
1.2%
Aleuts
90.7
/100
|
#122
Exceptional
1.2%
Zimbabweans
90.6
/100
|
#123
Exceptional
1.2%
Immigrants from Cambodia
90.5
/100
|
#124
Exceptional
1.2%
Japanese
90.3
/100
|
#125
Exceptional
1.2%

Immigrants from Venezuela Disability Age Under 5 Correlation Summary

MeasurementImmigrants from Venezuela DataDisability Age Under 5 Data
Minimum0.076%0.46%
Maximum14.3%2.5%
Range14.2%2.0%
Mean4.1%1.2%
Median3.6%1.2%
Interquartile 25% (IQ1)1.4%0.88%
Interquartile 75% (IQ3)6.0%1.4%
Interquartile Range (IQR)4.6%0.57%
Standard Deviation (Sample)3.4%0.43%
Standard Deviation (Population)3.4%0.42%

Correlation Details

Immigrants from Venezuela PercentileSample SizeDisability Age Under 5
[
0.0%
-
0.5%
]
0.076%
131,503,0561.0%
[
0.0%
-
0.5%
]
0.26%
20,607,0001.2%
[
0.0%
-
0.5%
]
0.46%
8,214,0261.2%
[
0.5%
-
1.0%
]
0.67%
5,019,0320.88%
[
0.5%
-
1.0%
]
0.86%
1,719,2691.6%
[
1.0%
-
1.5%
]
1.02%
1,250,6981.7%
[
1.0%
-
1.5%
]
1.23%
1,125,6251.7%
[
1.0%
-
1.5%
]
1.43%
573,3501.3%
[
1.5%
-
2.0%
]
1.62%
393,1241.3%
[
1.5%
-
2.0%
]
1.84%
140,2570.96%
[
1.5%
-
2.0%
]
1.99%
635,6081.7%
[
2.0%
-
2.5%
]
2.22%
71,6881.8%
[
2.0%
-
2.5%
]
2.35%
372,5380.83%
[
2.5%
-
3.0%
]
2.57%
147,9910.67%
[
3.0%
-
3.5%
]
3.13%
125,9400.57%
[
3.5%
-
4.0%
]
3.56%
486,6290.83%
[
3.5%
-
4.0%
]
3.72%
558,4571.2%
[
3.5%
-
4.0%
]
3.99%
42,2071.1%
[
4.0%
-
4.5%
]
4.10%
41,1021.0%
[
4.0%
-
4.5%
]
4.22%
78,9751.2%
[
4.5%
-
5.0%
]
4.50%
72,2932.5%
[
4.5%
-
5.0%
]
4.82%
49,8900.79%
[
5.0%
-
5.5%
]
5.08%
46,7981.3%
[
5.5%
-
6.0%
]
5.99%
144,0830.70%
[
6.0%
-
6.5%
]
6.45%
52,2401.4%
[
7.0%
-
7.5%
]
7.19%
23,7081.1%
[
7.0%
-
7.5%
]
7.27%
25,2831.6%
[
8.5%
-
9.0%
]
8.74%
48,7620.46%
[
9.5%
-
10.0%
]
9.70%
78,4781.3%
[
10.5%
-
11.0%
]
10.78%
57,0661.3%
[
14.0%
-
14.5%
]
14.26%
54,4641.4%