Immigrants from Venezuela Unemployment Among Women with Children Ages 6 to 17 years

COMPARE

Immigrants from Venezuela
Race
Ancestry
AfghanAfricanAlaska NativeAlaskan AthabascanAlbanianAleutAlsatianAmericanApacheArabArapahoArgentineanArmenianAssyrian/Chaldean/SyriacAustralianAustrianBahamianBangladeshiBarbadianBasqueBelgianBelizeanBermudanBhutaneseBlackfeetBolivianBrazilianBritishBritish West IndianBulgarianBurmeseCajunCambodianCanadianCape VerdeanCarpatho RusynCelticCentral AmericanCentral American IndianCherokeeCheyenneChickasawChileanChineseChippewaChoctawColombianColvilleComancheCosta RicanCreeCreekCroatianCrowCubanCypriotCzechCzechoslovakianDanishDelawareDominicanDutchDutch West IndianEastern EuropeanEcuadorianEgyptianEnglishEstonianEthiopianEuropeanFijianFilipinoFinnishFrenchFrench American IndianFrench CanadianGermanGerman RussianGhanaianGreekGuamanian/ChamorroGuatemalanGuyaneseHaitianHmongHonduranHopiHoumaHungarianIcelanderIndian (Asian)IndonesianInupiatIranianIraqiIrishIroquoisIsraeliItalianJamaicanJapaneseJordanianKenyanKiowaKoreanLaotianLatvianLebaneseLiberianLithuanianLumbeeLuxembourgerMacedonianMalaysianMalteseMarshalleseMenomineeMexicanMexican American IndianMongolianMoroccanNative HawaiianNavajoNepaleseNew ZealanderNicaraguanNigerianNorthern EuropeanNorwegianOkinawanOsageOttawaPaiutePakistaniPalestinianPanamanianParaguayanPennsylvania GermanPeruvianPimaPolishPortuguesePotawatomiPuebloPuerto RicanPuget Sound SalishRomanianRussianSalvadoranSamoanScandinavianScotch-IrishScottishSeminoleSenegaleseSerbianShoshoneSierra LeoneanSiouxSlavicSlovakSloveneSomaliSouth AfricanSouth AmericanSouth American IndianSoviet UnionSpaniardSpanishSpanish AmericanSpanish American IndianSri LankanSubsaharan AfricanSudaneseSwedishSwissSyrianTaiwaneseThaiTlingit-HaidaTohono O'OdhamTonganTrinidadian and TobagonianTsimshianTurkishU.S. Virgin IslanderUgandanUkrainianUruguayanUteVenezuelanVietnameseWelshWest IndianYakamaYaquiYugoslavianYumanYup'ikZimbabwean
Immigration
NonimmigrantsImmigrantsAfghanistanAfricaAlbaniaArgentinaArmeniaAsiaAustraliaAustriaBahamasBangladeshBarbadosBelarusBelgiumBelizeBoliviaBosnia and HerzegovinaBrazilBulgariaBurma/MyanmarCabo VerdeCambodiaCameroonCanadaCaribbeanCentral AmericaChileChinaColombiaCongoCosta RicaCroatiaCubaCzechoslovakiaDenmarkDominicaDominican RepublicEastern AfricaEastern AsiaEastern EuropeEcuadorEgyptEl SalvadorEnglandEritreaEthiopiaEuropeFijiFranceGermanyGhanaGreeceGrenadaGuatemalaGuyanaHaitiHondurasHong KongHungaryIndiaIndonesiaIranIraqIrelandIsraelItalyJamaicaJapanJordanKazakhstanKenyaKoreaKuwaitLaosLatin AmericaLatviaLebanonLiberiaLithuaniaMalaysiaMexicoMicronesiaMiddle AfricaMoldovaMoroccoNepalNetherlandsNicaraguaNigeriaNorth AmericaNorth MacedoniaNorthern AfricaNorthern EuropeNorwayOceaniaPakistanPanamaPeruPhilippinesPolandPortugalRomaniaRussiaSaudi ArabiaScotlandSenegalSerbiaSierra LeoneSingaporeSomaliaSouth AfricaSouth AmericaSouth Central AsiaSouth Eastern AsiaSouthern EuropeSpainSri LankaSt. Vincent and the GrenadinesSudanSwedenSwitzerlandSyriaTaiwanThailandTrinidad and TobagoTurkeyUgandaUkraineUruguayUzbekistanVenezuelaVietnamWest IndiesWestern AfricaWestern AsiaWestern EuropeYemenZaireZimbabweAzores
Select to Compare
Race
Ancestry
AfghanAfricanAlaska NativeAlaskan AthabascanAlbanianAleutAlsatianAmericanApacheArabArapahoArgentineanArmenianAssyrian/Chaldean/SyriacAustralianAustrianBahamianBangladeshiBarbadianBasqueBelgianBelizeanBermudanBhutaneseBlackfeetBolivianBrazilianBritishBritish West IndianBulgarianBurmeseCajunCambodianCanadianCape VerdeanCarpatho RusynCelticCentral AmericanCentral American IndianCherokeeCheyenneChickasawChileanChineseChippewaChoctawColombianColvilleComancheCosta RicanCreeCreekCroatianCrowCubanCypriotCzechCzechoslovakianDanishDelawareDominicanDutchDutch West IndianEastern EuropeanEcuadorianEgyptianEnglishEstonianEthiopianEuropeanFijianFilipinoFinnishFrenchFrench American IndianFrench CanadianGermanGerman RussianGhanaianGreekGuamanian/ChamorroGuatemalanGuyaneseHaitianHmongHonduranHopiHoumaHungarianIcelanderIndian (Asian)IndonesianInupiatIranianIraqiIrishIroquoisIsraeliItalianJamaicanJapaneseJordanianKenyanKiowaKoreanLaotianLatvianLebaneseLiberianLithuanianLumbeeLuxembourgerMacedonianMalaysianMalteseMarshalleseMenomineeMexicanMexican American IndianMongolianMoroccanNative HawaiianNavajoNepaleseNew ZealanderNicaraguanNigerianNorthern EuropeanNorwegianOkinawanOsageOttawaPaiutePakistaniPalestinianPanamanianParaguayanPennsylvania GermanPeruvianPimaPolishPortuguesePotawatomiPuebloPuerto RicanPuget Sound SalishRomanianRussianSalvadoranSamoanScandinavianScotch-IrishScottishSeminoleSenegaleseSerbianShoshoneSierra LeoneanSiouxSlavicSlovakSloveneSomaliSouth AfricanSouth AmericanSouth American IndianSoviet UnionSpaniardSpanishSpanish AmericanSpanish American IndianSri LankanSubsaharan AfricanSudaneseSwedishSwissSyrianTaiwaneseThaiTlingit-HaidaTohono O'OdhamTonganTrinidadian and TobagonianTsimshianTurkishU.S. Virgin IslanderUgandanUkrainianUruguayanUteVenezuelanVietnameseWelshWest IndianYakamaYaquiYugoslavianYumanYup'ikZimbabwean
Immigration
NonimmigrantsImmigrantsAfghanistanAfricaAlbaniaArgentinaArmeniaAsiaAustraliaAustriaBahamasBangladeshBarbadosBelarusBelgiumBelizeBoliviaBosnia and HerzegovinaBrazilBulgariaBurma/MyanmarCabo VerdeCambodiaCameroonCanadaCaribbeanCentral AmericaChileChinaColombiaCongoCosta RicaCroatiaCubaCzechoslovakiaDenmarkDominicaDominican RepublicEastern AfricaEastern AsiaEastern EuropeEcuadorEgyptEl SalvadorEnglandEritreaEthiopiaEuropeFijiFranceGermanyGhanaGreeceGrenadaGuatemalaGuyanaHaitiHondurasHong KongHungaryIndiaIndonesiaIranIraqIrelandIsraelItalyJamaicaJapanJordanKazakhstanKenyaKoreaKuwaitLaosLatin AmericaLatviaLebanonLiberiaLithuaniaMalaysiaMexicoMicronesiaMiddle AfricaMoldovaMoroccoNepalNetherlandsNicaraguaNigeriaNorth AmericaNorth MacedoniaNorthern AfricaNorthern EuropeNorwayOceaniaPakistanPanamaPeruPhilippinesPolandPortugalRomaniaRussiaSaudi ArabiaScotlandSenegalSerbiaSierra LeoneSingaporeSomaliaSouth AfricaSouth AmericaSouth Central AsiaSouth Eastern AsiaSouthern EuropeSpainSri LankaSt. Vincent and the GrenadinesSudanSwedenSwitzerlandSyriaTaiwanThailandTrinidad and TobagoTurkeyUgandaUkraineUruguayUzbekistanVietnamWest IndiesWestern AfricaWestern AsiaWestern EuropeYemenZaireZimbabweAzores
Unemployment Among Women with Children Ages 6 to 17 years
Income
Poverty
Unemployment
Labor Participation
Family Structure
Vehicle Availability
Education Level
Disability

Immigrants from Venezuela Unemployment Among Women with Children Ages 6 to 17 years
Tragic

10.2%
UNEMPLOYMENT | WOMEN W/ CHILDREN 6 TO 17
0.0/ 100
METRIC RATING
304th/ 347
METRIC RANK

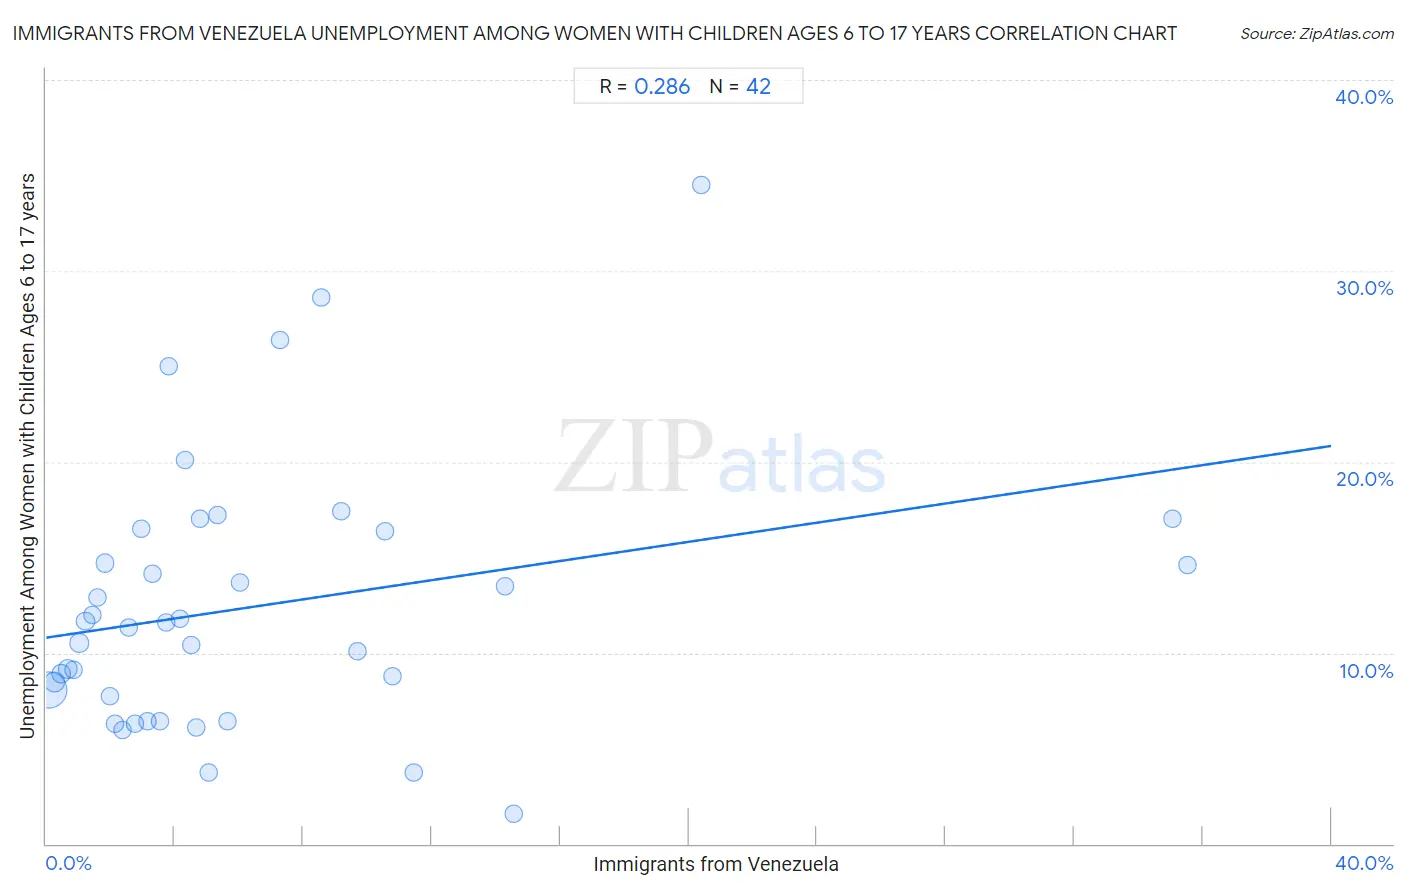
Immigrants from Venezuela Unemployment Among Women with Children Ages 6 to 17 years Correlation Chart

The statistical analysis conducted on geographies consisting of 220,713,316 people shows a weak positive correlation between the proportion of Immigrants from Venezuela and unemployment rate among women with children between the ages 6 and 17 in the United States with a correlation coefficient (R) of 0.286 and weighted average of 10.2%. On average, for every 1% (one percent) increase in Immigrants from Venezuela within a typical geography, there is an increase of 0.25% in unemployment rate among women with children between the ages 6 and 17.
Immigrants from Venezuela Unemployment Among Women with Children Ages 6 to 17 years
It is essential to understand that the correlation between the percentage of Immigrants from Venezuela and unemployment rate among women with children between the ages 6 and 17 does not imply a direct cause-and-effect relationship. It remains uncertain whether the presence of Immigrants from Venezuela influences an upward or downward trend in the level of unemployment rate among women with children between the ages 6 and 17 within an area, or if Immigrants from Venezuela simply ended up residing in those areas with higher or lower levels of unemployment rate among women with children between the ages 6 and 17 due to other factors.

Demographics Similar to Immigrants from Venezuela by Unemployment Among Women with Children Ages 6 to 17 years

In terms of unemployment among women with children ages 6 to 17 years, the demographic groups most similar to Immigrants from Venezuela are Immigrants from Nigeria (10.2%, a difference of 0.060%), Immigrants from Ecuador (10.2%, a difference of 0.090%), Venezuelan (10.2%, a difference of 0.27%), Paraguayan (10.2%, a difference of 0.35%), and Immigrants from Senegal (10.2%, a difference of 0.57%).
DemographicsRating | RankUnemployment Among Women with Children Ages 6 to 17 years
Immigrants from Caribbean
0.0
/100
|
#297
Tragic
10.1%
Immigrants from Haiti
0.0
/100
|
#298
Tragic
10.1%
Immigrants from Honduras
0.0
/100
|
#299
Tragic
10.1%
Nigerians
0.0
/100
|
#300
Tragic
10.1%
Immigrants from Bahamas
0.0
/100
|
#301
Tragic
10.1%
Venezuelans
0.0
/100
|
#302
Tragic
10.2%
Immigrants from Ecuador
0.0
/100
|
#303
Tragic
10.2%
Immigrants from Venezuela
0.0
/100
|
#304
Tragic
10.2%
Immigrants from Nigeria
0.0
/100
|
#305
Tragic
10.2%
Paraguayans
0.0
/100
|
#306
Tragic
10.2%
Immigrants from Senegal
0.0
/100
|
#307
Tragic
10.2%
Dutch West Indians
0.0
/100
|
#308
Tragic
10.2%
French Canadians
0.0
/100
|
#309
Tragic
10.3%
Alaska Natives
0.0
/100
|
#310
Tragic
10.3%
Immigrants from Liberia
0.0
/100
|
#311
Tragic
10.3%

Immigrants from Venezuela Unemployment Among Women with Children Ages 6 to 17 years Correlation Summary

MeasurementImmigrants from Venezuela DataUnemployment Among Women with Children Ages 6 to 17 years Data
Minimum0.076%1.6%
Maximum35.5%34.5%
Range35.5%32.9%
Mean6.5%12.4%
Median4.0%11.4%
Interquartile 25% (IQ1)2.0%7.7%
Interquartile 75% (IQ3)8.6%16.3%
Interquartile Range (IQR)6.6%8.6%
Standard Deviation (Sample)7.9%6.9%
Standard Deviation (Population)7.8%6.8%

Correlation Details

Immigrants from Venezuela PercentileSample SizeUnemployment Among Women with Children Ages 6 to 17 years
[
0.0%
-
0.5%
]
0.076%
159,753,5428.0%
[
0.0%
-
0.5%
]
0.26%
29,083,7168.5%
[
0.0%
-
0.5%
]
0.46%
11,498,1938.9%
[
0.5%
-
1.0%
]
0.67%
6,722,7229.2%
[
0.5%
-
1.0%
]
0.85%
3,055,0739.1%
[
1.0%
-
1.5%
]
1.03%
1,434,52610.5%
[
1.0%
-
1.5%
]
1.22%
1,684,25111.6%
[
1.0%
-
1.5%
]
1.43%
1,011,26912.0%
[
1.5%
-
2.0%
]
1.60%
604,05312.9%
[
1.5%
-
2.0%
]
1.85%
302,47414.7%
[
1.5%
-
2.0%
]
1.99%
1,011,6787.7%
[
2.0%
-
2.5%
]
2.14%
121,0296.3%
[
2.0%
-
2.5%
]
2.36%
333,1826.0%
[
2.5%
-
3.0%
]
2.56%
354,29111.3%
[
2.5%
-
3.0%
]
2.77%
194,9726.3%
[
2.5%
-
3.0%
]
2.94%
164,41916.5%
[
3.0%
-
3.5%
]
3.15%
284,4226.4%
[
3.0%
-
3.5%
]
3.32%
145,39514.2%
[
3.5%
-
4.0%
]
3.54%
631,2806.4%
[
3.5%
-
4.0%
]
3.73%
504,64711.6%
[
3.5%
-
4.0%
]
3.82%
28825.0%
[
4.0%
-
4.5%
]
4.16%
360,79311.8%
[
4.0%
-
4.5%
]
4.30%
275,00520.1%
[
4.5%
-
5.0%
]
4.53%
72,68410.4%
[
4.5%
-
5.0%
]
4.65%
65,0506.1%
[
4.5%
-
5.0%
]
4.80%
79,11817.0%
[
5.0%
-
5.5%
]
5.06%
73,6123.8%
[
5.0%
-
5.5%
]
5.34%
28,97817.2%
[
5.5%
-
6.0%
]
5.65%
146,9766.4%
[
6.0%
-
6.5%
]
6.01%
187,45713.7%
[
7.0%
-
7.5%
]
7.27%
25,28326.4%
[
8.5%
-
9.0%
]
8.56%
40,19128.6%
[
9.0%
-
9.5%
]
9.16%
14,55717.4%
[
9.5%
-
10.0%
]
9.70%
78,47810.1%
[
10.5%
-
11.0%
]
10.53%
66,29916.3%
[
10.5%
-
11.0%
]
10.78%
57,0668.8%
[
11.0%
-
11.5%
]
11.46%
20,0343.7%
[
14.0%
-
14.5%
]
14.26%
54,46413.5%
[
14.5%
-
15.0%
]
14.54%
26,3641.6%
[
20.0%
-
20.5%
]
20.40%
5,84334.5%
[
35.0%
-
35.5%
]
35.06%
64,75117.0%
[
35.5%
-
36.0%
]
35.53%
74,89114.6%