Immigrants from Latin America Disability Age Under 5
COMPARE
Immigrants from Latin America
Select to Compare
Disability Age Under 5
Immigrants from Latin America Disability Age Under 5
1.2%
DISABILITY | AGE UNDER 5
65.8/ 100
METRIC RATING
160th/ 347
METRIC RANK
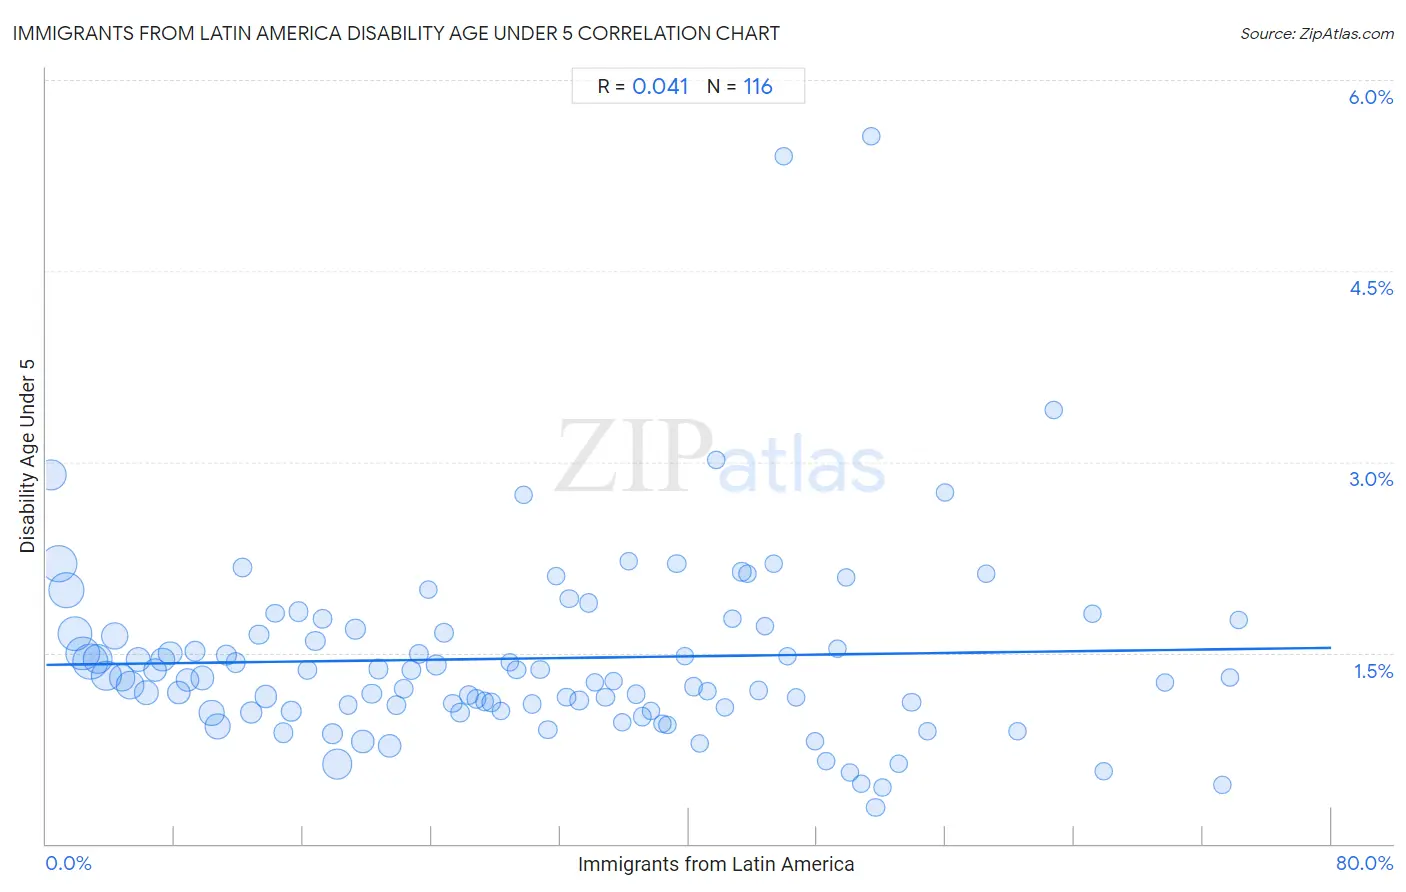
Immigrants from Latin America Disability Age Under 5 Correlation Chart
The statistical analysis conducted on geographies consisting of 260,180,620 people shows no correlation between the proportion of Immigrants from Latin America and percentage of population with a disability under the age of 5 in the United States with a correlation coefficient (R) of 0.041 and weighted average of 1.2%. On average, for every 1% (one percent) increase in Immigrants from Latin America within a typical geography, there is an increase of 0.0017% in percentage of population with a disability under the age of 5.
It is essential to understand that the correlation between the percentage of Immigrants from Latin America and percentage of population with a disability under the age of 5 does not imply a direct cause-and-effect relationship. It remains uncertain whether the presence of Immigrants from Latin America influences an upward or downward trend in the level of percentage of population with a disability under the age of 5 within an area, or if Immigrants from Latin America simply ended up residing in those areas with higher or lower levels of percentage of population with a disability under the age of 5 due to other factors.
Demographics Similar to Immigrants from Latin America by Disability Age Under 5
In terms of disability age under 5, the demographic groups most similar to Immigrants from Latin America are Colombian (1.2%, a difference of 0.0%), Arab (1.2%, a difference of 0.060%), Immigrants from Africa (1.2%, a difference of 0.070%), Immigrants from South America (1.2%, a difference of 0.12%), and Guatemalan (1.2%, a difference of 0.22%).
| Demographics | Rating | Rank | Disability Age Under 5 |
| Immigrants from Thailand | 69.4 /100 | #153 | Good 1.2% |
| Uruguayans | 68.8 /100 | #154 | Good 1.2% |
| Immigrants from Ghana | 68.7 /100 | #155 | Good 1.2% |
| Hawaiians | 68.5 /100 | #156 | Good 1.2% |
| Immigrants from South America | 67.0 /100 | #157 | Good 1.2% |
| Arabs | 66.4 /100 | #158 | Good 1.2% |
| Colombians | 65.8 /100 | #159 | Good 1.2% |
| Immigrants from Latin America | 65.8 /100 | #160 | Good 1.2% |
| Immigrants from Africa | 65.1 /100 | #161 | Good 1.2% |
| Guatemalans | 63.6 /100 | #162 | Good 1.2% |
| Immigrants from Guatemala | 63.2 /100 | #163 | Good 1.2% |
| Laotians | 62.8 /100 | #164 | Good 1.2% |
| Immigrants from Kuwait | 62.6 /100 | #165 | Good 1.2% |
| Immigrants from Central America | 61.4 /100 | #166 | Good 1.2% |
| Immigrants from Argentina | 60.2 /100 | #167 | Good 1.2% |
Immigrants from Latin America Disability Age Under 5 Correlation Summary
| Measurement | Immigrants from Latin America Data | Disability Age Under 5 Data |
| Minimum | 0.30% | 0.28% |
| Maximum | 74.3% | 5.6% |
| Range | 74.0% | 5.3% |
| Mean | 30.0% | 1.5% |
| Median | 29.1% | 1.3% |
| Interquartile 25% (IQ1) | 14.5% | 1.1% |
| Interquartile 75% (IQ3) | 43.5% | 1.7% |
| Interquartile Range (IQR) | 29.0% | 0.61% |
| Standard Deviation (Sample) | 18.6% | 0.76% |
| Standard Deviation (Population) | 18.6% | 0.76% |
Correlation Details
| Immigrants from Latin America Percentile | Sample Size | Disability Age Under 5 |
[ 0.0% - 0.5% ] 0.30% | 11,182,525 | 2.9% |
[ 0.5% - 1.0% ] 0.75% | 16,497,697 | 2.2% |
[ 1.0% - 1.5% ] 1.24% | 15,076,784 | 2.0% |
[ 1.5% - 2.0% ] 1.75% | 14,435,988 | 1.7% |
[ 2.0% - 2.5% ] 2.26% | 13,755,043 | 1.5% |
[ 2.5% - 3.0% ] 2.74% | 14,844,656 | 1.4% |
[ 3.0% - 3.5% ] 3.20% | 9,598,359 | 1.5% |
[ 3.5% - 4.0% ] 3.75% | 10,761,152 | 1.3% |
[ 4.0% - 4.5% ] 4.27% | 8,210,778 | 1.6% |
[ 4.5% - 5.0% ] 4.73% | 7,176,023 | 1.3% |
[ 5.0% - 5.5% ] 5.21% | 8,561,898 | 1.2% |
[ 5.5% - 6.0% ] 5.73% | 6,383,470 | 1.4% |
[ 6.0% - 6.5% ] 6.21% | 5,244,693 | 1.2% |
[ 6.5% - 7.0% ] 6.75% | 4,216,894 | 1.4% |
[ 7.0% - 7.5% ] 7.23% | 5,086,776 | 1.4% |
[ 7.5% - 8.0% ] 7.74% | 5,207,955 | 1.5% |
[ 8.0% - 8.5% ] 8.27% | 4,298,341 | 1.2% |
[ 8.5% - 9.0% ] 8.78% | 4,464,890 | 1.3% |
[ 9.0% - 9.5% ] 9.24% | 2,136,547 | 1.5% |
[ 9.5% - 10.0% ] 9.69% | 4,744,892 | 1.3% |
[ 10.0% - 10.5% ] 10.31% | 5,858,052 | 1.0% |
[ 10.5% - 11.0% ] 10.66% | 6,370,342 | 0.92% |
[ 11.0% - 11.5% ] 11.23% | 1,987,379 | 1.5% |
[ 11.5% - 12.0% ] 11.80% | 2,036,363 | 1.4% |
[ 12.0% - 12.5% ] 12.22% | 1,088,608 | 2.2% |
[ 12.5% - 13.0% ] 12.79% | 3,305,692 | 1.0% |
[ 13.0% - 13.5% ] 13.26% | 1,740,912 | 1.6% |
[ 13.5% - 14.0% ] 13.67% | 4,014,069 | 1.2% |
[ 14.0% - 14.5% ] 14.25% | 879,674 | 1.8% |
[ 14.5% - 15.0% ] 14.77% | 1,820,928 | 0.87% |
[ 15.0% - 15.5% ] 15.26% | 2,196,126 | 1.0% |
[ 15.5% - 16.0% ] 15.70% | 1,500,979 | 1.8% |
[ 16.0% - 16.5% ] 16.24% | 1,256,119 | 1.4% |
[ 16.5% - 17.0% ] 16.74% | 1,577,079 | 1.6% |
[ 17.0% - 17.5% ] 17.20% | 975,983 | 1.8% |
[ 17.5% - 18.0% ] 17.82% | 2,234,112 | 0.87% |
[ 18.0% - 18.5% ] 18.11% | 10,350,150 | 0.63% |
[ 18.5% - 19.0% ] 18.79% | 1,040,583 | 1.1% |
[ 19.0% - 19.5% ] 19.24% | 1,489,355 | 1.7% |
[ 19.5% - 20.0% ] 19.69% | 3,941,764 | 0.80% |
[ 20.0% - 20.5% ] 20.27% | 1,227,752 | 1.2% |
[ 20.5% - 21.0% ] 20.70% | 1,738,896 | 1.4% |
[ 21.0% - 21.5% ] 21.38% | 5,123,403 | 0.77% |
[ 21.5% - 22.0% ] 21.79% | 834,608 | 1.1% |
[ 22.0% - 22.5% ] 22.28% | 1,091,515 | 1.2% |
[ 22.5% - 23.0% ] 22.73% | 897,339 | 1.4% |
[ 23.0% - 23.5% ] 23.18% | 817,009 | 1.5% |
[ 23.5% - 24.0% ] 23.79% | 675,843 | 2.0% |
[ 24.0% - 24.5% ] 24.26% | 2,185,528 | 1.4% |
[ 24.5% - 25.0% ] 24.78% | 609,774 | 1.7% |
[ 25.0% - 25.5% ] 25.31% | 622,083 | 1.1% |
[ 25.5% - 26.0% ] 25.76% | 916,919 | 1.0% |
[ 26.0% - 26.5% ] 26.31% | 964,592 | 1.2% |
[ 26.5% - 27.0% ] 26.76% | 829,600 | 1.1% |
[ 27.0% - 27.5% ] 27.28% | 756,842 | 1.1% |
[ 27.5% - 28.0% ] 27.72% | 1,179,912 | 1.1% |
[ 28.0% - 28.5% ] 28.32% | 509,121 | 1.0% |
[ 28.5% - 29.0% ] 28.86% | 338,273 | 1.4% |
[ 29.0% - 29.5% ] 29.28% | 410,089 | 1.4% |
[ 29.5% - 30.0% ] 29.73% | 247,710 | 2.7% |
[ 30.0% - 30.5% ] 30.25% | 633,492 | 1.1% |
[ 30.5% - 31.0% ] 30.73% | 769,005 | 1.4% |
[ 31.0% - 31.5% ] 31.22% | 513,772 | 0.89% |
[ 31.5% - 32.0% ] 31.77% | 225,252 | 2.1% |
[ 32.0% - 32.5% ] 32.40% | 558,774 | 1.2% |
[ 32.5% - 33.0% ] 32.56% | 186,328 | 1.9% |
[ 33.0% - 33.5% ] 33.18% | 268,702 | 1.1% |
[ 33.5% - 34.0% ] 33.79% | 299,067 | 1.9% |
[ 34.0% - 34.5% ] 34.18% | 233,516 | 1.3% |
[ 34.5% - 35.0% ] 34.81% | 354,757 | 1.2% |
[ 35.0% - 35.5% ] 35.34% | 301,695 | 1.3% |
[ 35.5% - 36.0% ] 35.85% | 392,284 | 0.95% |
[ 36.0% - 36.5% ] 36.24% | 60,009 | 2.2% |
[ 36.5% - 37.0% ] 36.70% | 276,052 | 1.2% |
[ 37.0% - 37.5% ] 37.09% | 335,769 | 1.00% |
[ 37.5% - 38.0% ] 37.66% | 524,669 | 1.0% |
[ 38.0% - 38.5% ] 38.39% | 120,385 | 0.94% |
[ 38.5% - 39.0% ] 38.69% | 147,736 | 0.94% |
[ 39.0% - 39.5% ] 39.26% | 204,373 | 2.2% |
[ 39.5% - 40.0% ] 39.77% | 241,727 | 1.5% |
[ 40.0% - 40.5% ] 40.28% | 358,844 | 1.2% |
[ 40.5% - 41.0% ] 40.69% | 514,982 | 0.79% |
[ 41.0% - 41.5% ] 41.18% | 63,884 | 1.2% |
[ 41.5% - 42.0% ] 41.69% | 79,734 | 3.0% |
[ 42.0% - 42.5% ] 42.24% | 206,890 | 1.1% |
[ 42.5% - 43.0% ] 42.69% | 99,930 | 1.8% |
[ 43.0% - 43.5% ] 43.30% | 160,744 | 2.1% |
[ 43.5% - 44.0% ] 43.67% | 81,820 | 2.1% |
[ 44.0% - 44.5% ] 44.33% | 247,924 | 1.2% |
[ 44.5% - 45.0% ] 44.77% | 150,984 | 1.7% |
[ 45.0% - 45.5% ] 45.27% | 89,457 | 2.2% |
[ 45.5% - 46.0% ] 45.94% | 17,192 | 5.4% |
[ 46.0% - 46.5% ] 46.15% | 48,326 | 1.5% |
[ 46.5% - 47.0% ] 46.71% | 161,919 | 1.1% |
[ 47.5% - 48.0% ] 47.83% | 50,387 | 0.81% |
[ 48.5% - 49.0% ] 48.58% | 176,953 | 0.65% |
[ 49.0% - 49.5% ] 49.23% | 94,749 | 1.5% |
[ 49.5% - 50.0% ] 49.81% | 111,945 | 2.1% |
[ 50.0% - 50.5% ] 50.05% | 29,530 | 0.56% |
[ 50.5% - 51.0% ] 50.72% | 56,696 | 0.48% |
[ 51.0% - 51.5% ] 51.33% | 5,922 | 5.6% |
[ 51.5% - 52.0% ] 51.63% | 59,854 | 0.28% |
[ 52.0% - 52.5% ] 52.06% | 43,702 | 0.44% |
[ 53.0% - 53.5% ] 53.05% | 35,705 | 0.62% |
[ 53.5% - 54.0% ] 53.89% | 443,665 | 1.1% |
[ 54.5% - 55.0% ] 54.90% | 37,977 | 0.88% |
[ 55.5% - 56.0% ] 55.92% | 29,240 | 2.8% |
[ 58.0% - 58.5% ] 58.49% | 24,969 | 2.1% |
[ 60.0% - 60.5% ] 60.45% | 24,597 | 0.88% |
[ 62.5% - 63.0% ] 62.70% | 13,163 | 3.4% |
[ 65.0% - 65.5% ] 65.13% | 34,335 | 1.8% |
[ 65.5% - 66.0% ] 65.81% | 52,851 | 0.56% |
[ 69.5% - 70.0% ] 69.67% | 57,066 | 1.3% |
[ 73.0% - 73.5% ] 73.24% | 222,996 | 0.46% |
[ 73.5% - 74.0% ] 73.72% | 46,798 | 1.3% |
[ 74.0% - 74.5% ] 74.26% | 71,088 | 1.8% |