Immigrants from Latin America vs Assyrian/Chaldean/Syriac Married-Couple Family Poverty
COMPARE
Immigrants from Latin America
Assyrian/Chaldean/Syriac
Married-Couple Family Poverty
Married-Couple Family Poverty Comparison
Immigrants from Latin America
Assyrians/Chaldeans/Syriacs
7.2%
MARRIED-COUPLE FAMILY POVERTY
0.0/ 100
METRIC RATING
319th/ 347
METRIC RANK
4.9%
MARRIED-COUPLE FAMILY POVERTY
89.4/ 100
METRIC RATING
135th/ 347
METRIC RANK
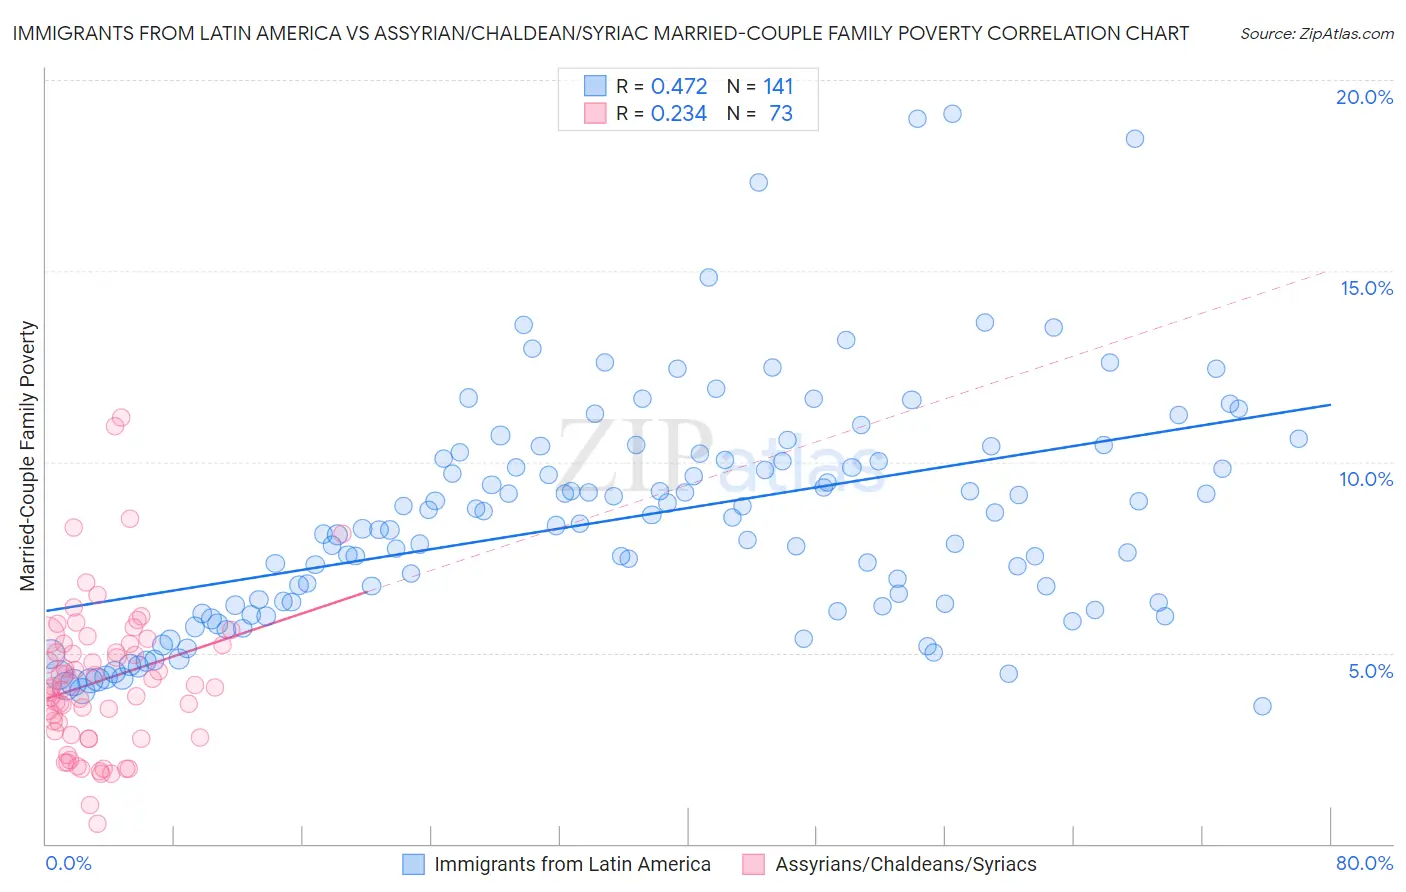
Immigrants from Latin America vs Assyrian/Chaldean/Syriac Married-Couple Family Poverty Correlation Chart
The statistical analysis conducted on geographies consisting of 546,700,324 people shows a moderate positive correlation between the proportion of Immigrants from Latin America and poverty level among married-couple families in the United States with a correlation coefficient (R) of 0.472 and weighted average of 7.2%. Similarly, the statistical analysis conducted on geographies consisting of 109,936,047 people shows a weak positive correlation between the proportion of Assyrians/Chaldeans/Syriacs and poverty level among married-couple families in the United States with a correlation coefficient (R) of 0.234 and weighted average of 4.9%, a difference of 47.1%.
Married-Couple Family Poverty Correlation Summary
| Measurement | Immigrants from Latin America | Assyrian/Chaldean/Syriac |
| Minimum | 3.6% | 0.54% |
| Maximum | 19.1% | 11.2% |
| Range | 15.5% | 10.6% |
| Mean | 8.5% | 4.3% |
| Median | 8.3% | 4.1% |
| Interquartile 25% (IQ1) | 6.2% | 2.8% |
| Interquartile 75% (IQ3) | 10.1% | 5.2% |
| Interquartile Range (IQR) | 3.9% | 2.4% |
| Standard Deviation (Sample) | 3.0% | 2.0% |
| Standard Deviation (Population) | 3.0% | 2.0% |
Similar Demographics by Married-Couple Family Poverty
Demographics Similar to Immigrants from Latin America by Married-Couple Family Poverty
In terms of married-couple family poverty, the demographic groups most similar to Immigrants from Latin America are Immigrants from Guatemala (7.2%, a difference of 0.17%), Mexican (7.2%, a difference of 0.34%), Honduran (7.2%, a difference of 0.65%), Inupiat (7.1%, a difference of 0.81%), and British West Indian (7.1%, a difference of 1.1%).
| Demographics | Rating | Rank | Married-Couple Family Poverty |
| Immigrants | Armenia | 0.0 /100 | #312 | Tragic 7.1% |
| Immigrants | St. Vincent and the Grenadines | 0.0 /100 | #313 | Tragic 7.1% |
| British West Indians | 0.0 /100 | #314 | Tragic 7.1% |
| Inupiat | 0.0 /100 | #315 | Tragic 7.1% |
| Hondurans | 0.0 /100 | #316 | Tragic 7.2% |
| Mexicans | 0.0 /100 | #317 | Tragic 7.2% |
| Immigrants | Guatemala | 0.0 /100 | #318 | Tragic 7.2% |
| Immigrants | Latin America | 0.0 /100 | #319 | Tragic 7.2% |
| Immigrants | Grenada | 0.0 /100 | #320 | Tragic 7.3% |
| Immigrants | Caribbean | 0.0 /100 | #321 | Tragic 7.3% |
| Immigrants | Honduras | 0.0 /100 | #322 | Tragic 7.3% |
| Vietnamese | 0.0 /100 | #323 | Tragic 7.4% |
| Immigrants | Central America | 0.0 /100 | #324 | Tragic 7.4% |
| Immigrants | Cuba | 0.0 /100 | #325 | Tragic 7.5% |
| Immigrants | Bangladesh | 0.0 /100 | #326 | Tragic 7.5% |
Demographics Similar to Assyrians/Chaldeans/Syriacs by Married-Couple Family Poverty
In terms of married-couple family poverty, the demographic groups most similar to Assyrians/Chaldeans/Syriacs are Immigrants from Hungary (4.9%, a difference of 0.22%), Samoan (4.9%, a difference of 0.28%), Immigrants from Kenya (4.9%, a difference of 0.29%), Puget Sound Salish (4.9%, a difference of 0.36%), and Immigrants from Eastern Europe (4.9%, a difference of 0.37%).
| Demographics | Rating | Rank | Married-Couple Family Poverty |
| Palestinians | 91.2 /100 | #128 | Exceptional 4.9% |
| Immigrants | Pakistan | 90.7 /100 | #129 | Exceptional 4.9% |
| Soviet Union | 90.7 /100 | #130 | Exceptional 4.9% |
| Immigrants | Eastern Europe | 90.5 /100 | #131 | Exceptional 4.9% |
| Puget Sound Salish | 90.4 /100 | #132 | Exceptional 4.9% |
| Immigrants | Kenya | 90.2 /100 | #133 | Exceptional 4.9% |
| Samoans | 90.2 /100 | #134 | Exceptional 4.9% |
| Assyrians/Chaldeans/Syriacs | 89.4 /100 | #135 | Excellent 4.9% |
| Immigrants | Hungary | 88.7 /100 | #136 | Excellent 4.9% |
| Guamanians/Chamorros | 86.5 /100 | #137 | Excellent 4.9% |
| Chileans | 86.0 /100 | #138 | Excellent 4.9% |
| German Russians | 85.1 /100 | #139 | Excellent 5.0% |
| Immigrants | Portugal | 84.8 /100 | #140 | Excellent 5.0% |
| Immigrants | Brazil | 84.6 /100 | #141 | Excellent 5.0% |
| Immigrants | China | 84.6 /100 | #142 | Excellent 5.0% |