Immigrants from Latin America Cognitive Disability
COMPARE
Immigrants from Latin America
Select to Compare
Cognitive Disability
Immigrants from Latin America Cognitive Disability
17.6%
COGNITIVE DISABILITY
9.7/ 100
METRIC RATING
207th/ 347
METRIC RANK
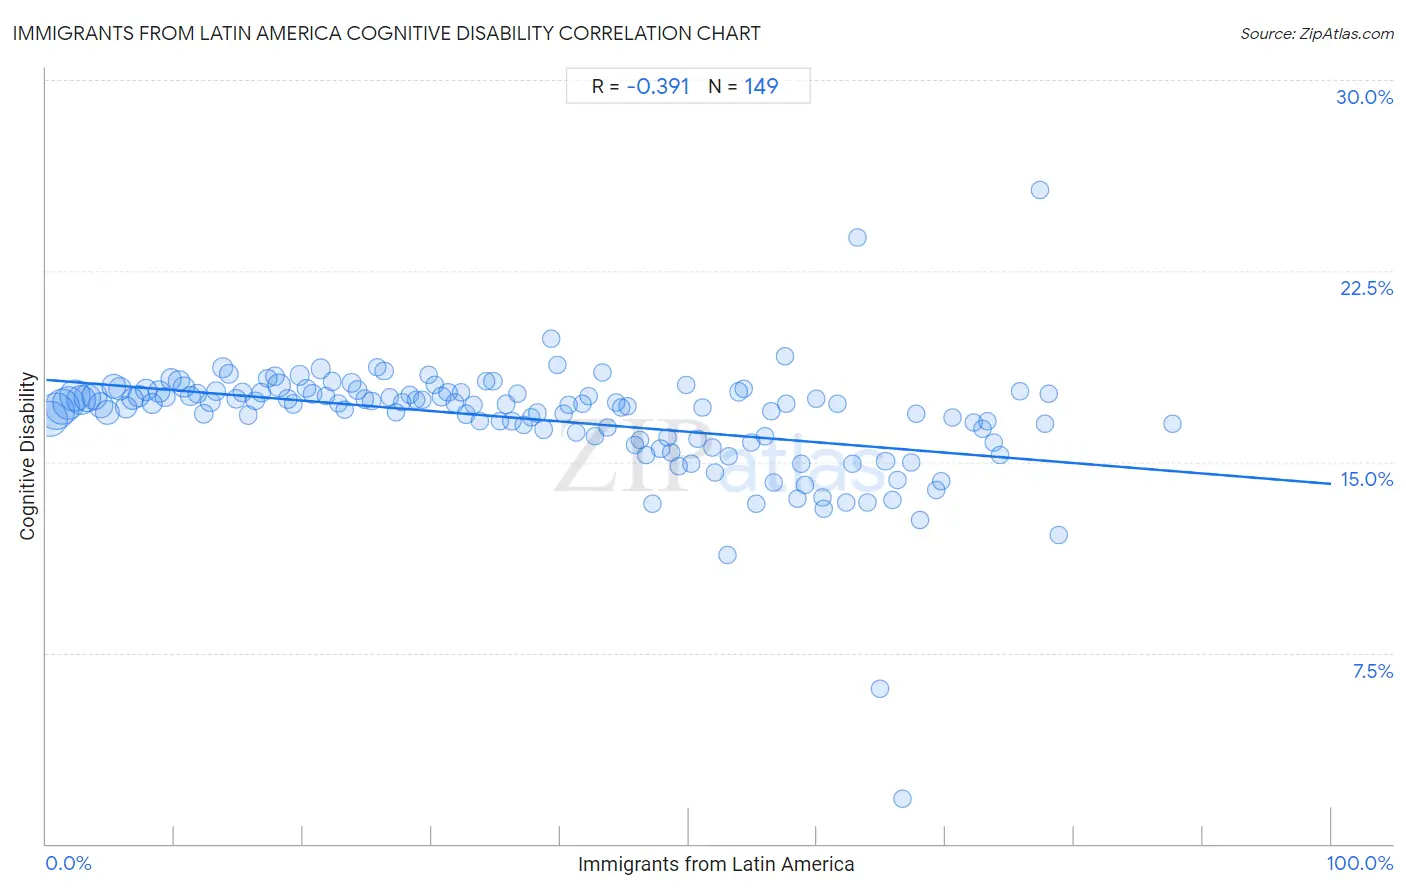
Immigrants from Latin America Cognitive Disability Correlation Chart
The statistical analysis conducted on geographies consisting of 558,464,403 people shows a mild negative correlation between the proportion of Immigrants from Latin America and percentage of population with cognitive disability in the United States with a correlation coefficient (R) of -0.391 and weighted average of 17.6%. On average, for every 1% (one percent) increase in Immigrants from Latin America within a typical geography, there is a decrease of 0.041% in percentage of population with cognitive disability.
It is essential to understand that the correlation between the percentage of Immigrants from Latin America and percentage of population with cognitive disability does not imply a direct cause-and-effect relationship. It remains uncertain whether the presence of Immigrants from Latin America influences an upward or downward trend in the level of percentage of population with cognitive disability within an area, or if Immigrants from Latin America simply ended up residing in those areas with higher or lower levels of percentage of population with cognitive disability due to other factors.
Demographics Similar to Immigrants from Latin America by Cognitive Disability
In terms of cognitive disability, the demographic groups most similar to Immigrants from Latin America are Immigrants from Cameroon (17.6%, a difference of 0.030%), Alaska Native (17.5%, a difference of 0.050%), Immigrants from Trinidad and Tobago (17.6%, a difference of 0.080%), Puget Sound Salish (17.5%, a difference of 0.090%), and Immigrants from Caribbean (17.5%, a difference of 0.10%).
| Demographics | Rating | Rank | Cognitive Disability |
| Haitians | 14.1 /100 | #200 | Poor 17.5% |
| South American Indians | 13.0 /100 | #201 | Poor 17.5% |
| Immigrants from Morocco | 12.0 /100 | #202 | Poor 17.5% |
| Immigrants from Caribbean | 11.0 /100 | #203 | Poor 17.5% |
| Immigrants from Zimbabwe | 11.0 /100 | #204 | Poor 17.5% |
| Puget Sound Salish | 10.9 /100 | #205 | Poor 17.5% |
| Alaska Natives | 10.4 /100 | #206 | Poor 17.5% |
| Immigrants from Latin America | 9.7 /100 | #207 | Tragic 17.6% |
| Immigrants from Cameroon | 9.3 /100 | #208 | Tragic 17.6% |
| Immigrants from Trinidad and Tobago | 8.7 /100 | #209 | Tragic 17.6% |
| Immigrants from Jamaica | 8.5 /100 | #210 | Tragic 17.6% |
| Taiwanese | 7.7 /100 | #211 | Tragic 17.6% |
| Immigrants from Oceania | 7.3 /100 | #212 | Tragic 17.6% |
| Hawaiians | 7.2 /100 | #213 | Tragic 17.6% |
| Immigrants from El Salvador | 7.0 /100 | #214 | Tragic 17.6% |
Immigrants from Latin America Cognitive Disability Correlation Summary
| Measurement | Immigrants from Latin America Data | Cognitive Disability Data |
| Minimum | 0.27% | 1.8% |
| Maximum | 87.6% | 25.7% |
| Range | 87.4% | 23.9% |
| Mean | 37.7% | 16.7% |
| Median | 37.1% | 17.3% |
| Interquartile 25% (IQ1) | 18.5% | 16.0% |
| Interquartile 75% (IQ3) | 56.2% | 17.7% |
| Interquartile Range (IQR) | 37.7% | 1.7% |
| Standard Deviation (Sample) | 22.3% | 2.3% |
| Standard Deviation (Population) | 22.3% | 2.3% |
Correlation Details
| Immigrants from Latin America Percentile | Sample Size | Cognitive Disability |
[ 0.0% - 0.5% ] 0.27% | 45,326,761 | 16.7% |
[ 0.5% - 1.0% ] 0.75% | 48,826,862 | 17.0% |
[ 1.0% - 1.5% ] 1.24% | 43,103,225 | 17.2% |
[ 1.5% - 2.0% ] 1.75% | 36,559,059 | 17.3% |
[ 2.0% - 2.5% ] 2.25% | 32,724,991 | 17.6% |
[ 2.5% - 3.0% ] 2.75% | 29,480,110 | 17.4% |
[ 3.0% - 3.5% ] 3.22% | 23,810,175 | 17.5% |
[ 3.5% - 4.0% ] 3.75% | 22,372,628 | 17.6% |
[ 4.0% - 4.5% ] 4.25% | 18,585,851 | 17.2% |
[ 4.5% - 5.0% ] 4.75% | 16,775,975 | 16.9% |
[ 5.0% - 5.5% ] 5.23% | 16,114,840 | 18.0% |
[ 5.5% - 6.0% ] 5.74% | 13,006,117 | 17.9% |
[ 6.0% - 6.5% ] 6.24% | 10,834,646 | 17.1% |
[ 6.5% - 7.0% ] 6.74% | 9,553,692 | 17.5% |
[ 7.0% - 7.5% ] 7.24% | 10,038,630 | 17.6% |
[ 7.5% - 8.0% ] 7.74% | 10,134,159 | 17.8% |
[ 8.0% - 8.5% ] 8.26% | 8,110,807 | 17.3% |
[ 8.5% - 9.0% ] 8.77% | 8,040,629 | 17.8% |
[ 9.0% - 9.5% ] 9.25% | 5,431,902 | 17.5% |
[ 9.5% - 10.0% ] 9.71% | 7,225,952 | 18.3% |
[ 10.0% - 10.5% ] 10.29% | 8,827,131 | 18.2% |
[ 10.5% - 11.0% ] 10.68% | 8,938,898 | 17.9% |
[ 11.0% - 11.5% ] 11.23% | 4,323,716 | 17.6% |
[ 11.5% - 12.0% ] 11.77% | 3,788,370 | 17.7% |
[ 12.0% - 12.5% ] 12.23% | 3,121,763 | 16.9% |
[ 12.5% - 13.0% ] 12.77% | 5,407,821 | 17.4% |
[ 13.0% - 13.5% ] 13.25% | 3,836,311 | 17.8% |
[ 13.5% - 14.0% ] 13.70% | 5,398,786 | 18.7% |
[ 14.0% - 14.5% ] 14.25% | 2,800,968 | 18.5% |
[ 14.5% - 15.0% ] 14.77% | 3,189,381 | 17.5% |
[ 15.0% - 15.5% ] 15.26% | 3,412,183 | 17.7% |
[ 15.5% - 16.0% ] 15.72% | 2,911,944 | 16.8% |
[ 16.0% - 16.5% ] 16.24% | 2,146,661 | 17.4% |
[ 16.5% - 17.0% ] 16.74% | 2,948,602 | 17.7% |
[ 17.0% - 17.5% ] 17.24% | 2,147,716 | 18.3% |
[ 17.5% - 18.0% ] 17.80% | 3,378,898 | 18.4% |
[ 18.0% - 18.5% ] 18.12% | 11,266,967 | 18.0% |
[ 18.5% - 19.0% ] 18.78% | 2,077,813 | 17.5% |
[ 19.0% - 19.5% ] 19.24% | 2,213,769 | 17.3% |
[ 19.5% - 20.0% ] 19.71% | 4,717,521 | 18.4% |
[ 20.0% - 20.5% ] 20.25% | 2,023,778 | 17.9% |
[ 20.5% - 21.0% ] 20.71% | 2,719,076 | 17.7% |
[ 21.0% - 21.5% ] 21.37% | 5,960,808 | 18.7% |
[ 21.5% - 22.0% ] 21.77% | 1,387,646 | 17.6% |
[ 22.0% - 22.5% ] 22.24% | 2,020,467 | 18.2% |
[ 22.5% - 23.0% ] 22.74% | 1,577,268 | 17.3% |
[ 23.0% - 23.5% ] 23.24% | 1,824,331 | 17.0% |
[ 23.5% - 24.0% ] 23.78% | 1,497,404 | 18.1% |
[ 24.0% - 24.5% ] 24.24% | 2,965,463 | 17.8% |
[ 24.5% - 25.0% ] 24.76% | 1,190,752 | 17.5% |
[ 25.0% - 25.5% ] 25.30% | 1,257,701 | 17.4% |
[ 25.5% - 26.0% ] 25.77% | 1,402,530 | 18.7% |
[ 26.0% - 26.5% ] 26.30% | 1,355,692 | 18.6% |
[ 26.5% - 27.0% ] 26.74% | 1,224,616 | 17.5% |
[ 27.0% - 27.5% ] 27.25% | 1,203,445 | 17.0% |
[ 27.5% - 28.0% ] 27.73% | 1,388,494 | 17.3% |
[ 28.0% - 28.5% ] 28.29% | 1,053,821 | 17.6% |
[ 28.5% - 29.0% ] 28.79% | 966,216 | 17.4% |
[ 29.0% - 29.5% ] 29.27% | 836,044 | 17.4% |
[ 29.5% - 30.0% ] 29.74% | 778,205 | 18.4% |
[ 30.0% - 30.5% ] 30.25% | 875,325 | 18.0% |
[ 30.5% - 31.0% ] 30.76% | 1,336,820 | 17.6% |
[ 31.0% - 31.5% ] 31.26% | 835,409 | 17.7% |
[ 31.5% - 32.0% ] 31.78% | 763,844 | 17.3% |
[ 32.0% - 32.5% ] 32.30% | 1,090,265 | 17.7% |
[ 32.5% - 33.0% ] 32.70% | 858,230 | 16.9% |
[ 33.0% - 33.5% ] 33.25% | 673,532 | 17.2% |
[ 33.5% - 34.0% ] 33.75% | 625,902 | 16.6% |
[ 34.0% - 34.5% ] 34.19% | 358,518 | 18.2% |
[ 34.5% - 35.0% ] 34.77% | 711,982 | 18.2% |
[ 35.0% - 35.5% ] 35.30% | 503,056 | 16.6% |
[ 35.5% - 36.0% ] 35.81% | 727,398 | 17.3% |
[ 36.0% - 36.5% ] 36.23% | 319,984 | 16.6% |
[ 36.5% - 37.0% ] 36.71% | 449,319 | 17.7% |
[ 37.0% - 37.5% ] 37.13% | 505,313 | 16.5% |
[ 37.5% - 38.0% ] 37.70% | 694,549 | 16.8% |
[ 38.0% - 38.5% ] 38.21% | 507,097 | 16.9% |
[ 38.5% - 39.0% ] 38.69% | 509,882 | 16.3% |
[ 39.0% - 39.5% ] 39.27% | 291,084 | 19.8% |
[ 39.5% - 40.0% ] 39.77% | 409,871 | 18.8% |
[ 40.0% - 40.5% ] 40.27% | 522,560 | 16.9% |
[ 40.5% - 41.0% ] 40.67% | 737,522 | 17.2% |
[ 41.0% - 41.5% ] 41.22% | 181,381 | 16.2% |
[ 41.5% - 42.0% ] 41.73% | 167,007 | 17.3% |
[ 42.0% - 42.5% ] 42.24% | 434,521 | 17.6% |
[ 42.5% - 43.0% ] 42.73% | 420,372 | 16.0% |
[ 43.0% - 43.5% ] 43.31% | 238,058 | 18.5% |
[ 43.5% - 44.0% ] 43.69% | 207,488 | 16.4% |
[ 44.0% - 44.5% ] 44.34% | 328,210 | 17.4% |
[ 44.5% - 45.0% ] 44.72% | 288,811 | 17.1% |
[ 45.0% - 45.5% ] 45.24% | 127,862 | 17.2% |
[ 45.5% - 46.0% ] 45.85% | 173,696 | 15.7% |
[ 46.0% - 46.5% ] 46.17% | 107,212 | 15.9% |
[ 46.5% - 47.0% ] 46.72% | 226,937 | 15.3% |
[ 47.0% - 47.5% ] 47.16% | 201,590 | 13.4% |
[ 47.5% - 48.0% ] 47.81% | 157,334 | 15.5% |
[ 48.0% - 48.5% ] 48.38% | 48,779 | 16.0% |
[ 48.5% - 49.0% ] 48.65% | 270,648 | 15.4% |
[ 49.0% - 49.5% ] 49.22% | 96,782 | 14.8% |
[ 49.5% - 50.0% ] 49.81% | 249,542 | 18.0% |
[ 50.0% - 50.5% ] 50.15% | 86,921 | 14.9% |
[ 50.5% - 51.0% ] 50.72% | 111,589 | 15.9% |
[ 51.0% - 51.5% ] 51.11% | 21,106 | 17.1% |
[ 51.5% - 52.0% ] 51.81% | 133,698 | 15.6% |
[ 52.0% - 52.5% ] 52.07% | 45,589 | 14.6% |
[ 52.5% - 53.0% ] 52.98% | 13,877 | 11.4% |
[ 53.0% - 53.5% ] 53.10% | 55,370 | 15.2% |
[ 53.5% - 54.0% ] 53.89% | 443,715 | 17.8% |
[ 54.0% - 54.5% ] 54.26% | 35,373 | 17.9% |
[ 54.5% - 55.0% ] 54.90% | 38,109 | 15.8% |
[ 55.0% - 55.5% ] 55.24% | 13,787 | 13.4% |
[ 55.5% - 56.0% ] 55.93% | 55,613 | 16.0% |
[ 56.0% - 56.5% ] 56.38% | 16,414 | 17.0% |
[ 56.5% - 57.0% ] 56.59% | 68,833 | 14.2% |
[ 57.0% - 57.5% ] 57.49% | 7,181 | 19.1% |
[ 57.5% - 58.0% ] 57.58% | 1,023 | 17.3% |
[ 58.0% - 58.5% ] 58.48% | 26,073 | 13.6% |
[ 58.5% - 59.0% ] 58.77% | 7,764 | 14.9% |
[ 59.0% - 59.5% ] 59.08% | 51,120 | 14.1% |
[ 59.5% - 60.0% ] 59.91% | 95,797 | 17.5% |
[ 60.0% - 60.5% ] 60.44% | 25,128 | 13.6% |
[ 60.5% - 61.0% ] 60.52% | 83,972 | 13.2% |
[ 61.5% - 62.0% ] 61.54% | 11,374 | 17.3% |
[ 62.0% - 62.5% ] 62.23% | 108,055 | 13.4% |
[ 62.5% - 63.0% ] 62.73% | 14,911 | 14.9% |
[ 63.0% - 63.5% ] 63.13% | 358 | 23.8% |
[ 63.5% - 64.0% ] 63.90% | 167,279 | 13.4% |
[ 64.5% - 65.0% ] 64.84% | 1,061 | 6.1% |
[ 65.0% - 65.5% ] 65.32% | 109,226 | 15.0% |
[ 65.5% - 66.0% ] 65.81% | 52,851 | 13.5% |
[ 66.0% - 66.5% ] 66.26% | 44,768 | 14.3% |
[ 66.5% - 67.0% ] 66.67% | 114 | 1.8% |
[ 67.0% - 67.5% ] 67.28% | 40,406 | 15.0% |
[ 67.5% - 68.0% ] 67.74% | 54,873 | 16.9% |
[ 68.0% - 68.5% ] 68.02% | 20,850 | 12.7% |
[ 69.0% - 69.5% ] 69.27% | 26,596 | 13.9% |
[ 69.5% - 70.0% ] 69.67% | 57,066 | 14.2% |
[ 70.5% - 71.0% ] 70.54% | 68,575 | 16.7% |
[ 72.0% - 72.5% ] 72.20% | 19,399 | 16.6% |
[ 72.5% - 73.0% ] 72.82% | 64,572 | 16.3% |
[ 73.0% - 73.5% ] 73.24% | 222,996 | 16.6% |
[ 73.5% - 74.0% ] 73.72% | 46,798 | 15.8% |
[ 74.0% - 74.5% ] 74.26% | 71,119 | 15.3% |
[ 75.5% - 76.0% ] 75.74% | 1,018 | 17.8% |
[ 77.0% - 77.5% ] 77.38% | 84 | 25.7% |
[ 77.5% - 78.0% ] 77.68% | 112 | 16.5% |
[ 78.0% - 78.5% ] 78.01% | 42,081 | 17.7% |
[ 78.5% - 79.0% ] 78.79% | 33 | 12.1% |
[ 87.5% - 88.0% ] 87.63% | 97 | 16.5% |