Immigrants from Kuwait vs Ethiopian GED/Equivalency

COMPARE

Immigrants from Kuwait
Race
Ancestry
AfghanAfricanAlaska NativeAlaskan AthabascanAlbanianAleutAlsatianAmericanApacheArabArapahoArgentineanArmenianAssyrian/Chaldean/SyriacAustralianAustrianBahamianBangladeshiBarbadianBasqueBelgianBelizeanBermudanBhutaneseBlackfeetBolivianBrazilianBritishBritish West IndianBulgarianBurmeseCajunCambodianCanadianCape VerdeanCarpatho RusynCelticCentral AmericanCentral American IndianCherokeeCheyenneChickasawChileanChineseChippewaChoctawColombianColvilleComancheCosta RicanCreeCreekCroatianCrowCubanCypriotCzechCzechoslovakianDanishDelawareDominicanDutchDutch West IndianEastern EuropeanEcuadorianEgyptianEnglishEstonianEuropeanFijianFilipinoFinnishFrenchFrench American IndianFrench CanadianGermanGerman RussianGhanaianGreekGuamanian/ChamorroGuatemalanGuyaneseHaitianHmongHonduranHopiHoumaHungarianIcelanderIndian (Asian)IndonesianInupiatIranianIraqiIrishIroquoisIsraeliItalianJamaicanJapaneseJordanianKenyanKiowaKoreanLaotianLatvianLebaneseLiberianLithuanianLumbeeLuxembourgerMacedonianMalaysianMalteseMarshalleseMenomineeMexicanMexican American IndianMongolianMoroccanNative HawaiianNavajoNepaleseNew ZealanderNicaraguanNigerianNorthern EuropeanNorwegianOkinawanOsageOttawaPaiutePakistaniPalestinianPanamanianParaguayanPennsylvania GermanPeruvianPimaPolishPortuguesePotawatomiPuebloPuerto RicanPuget Sound SalishRomanianRussianSalvadoranSamoanScandinavianScotch-IrishScottishSeminoleSenegaleseSerbianShoshoneSierra LeoneanSiouxSlavicSlovakSloveneSomaliSouth AfricanSouth AmericanSouth American IndianSoviet UnionSpaniardSpanishSpanish AmericanSpanish American IndianSri LankanSubsaharan AfricanSudaneseSwedishSwissSyrianTaiwaneseThaiTlingit-HaidaTohono O'OdhamTonganTrinidadian and TobagonianTsimshianTurkishU.S. Virgin IslanderUgandanUkrainianUruguayanUteVenezuelanVietnameseWelshWest IndianYakamaYaquiYugoslavianYumanYup'ikZimbabwean
Immigration
NonimmigrantsImmigrantsAfghanistanAfricaAlbaniaArgentinaArmeniaAsiaAustraliaAustriaBahamasBangladeshBarbadosBelarusBelgiumBelizeBoliviaBosnia and HerzegovinaBrazilBulgariaBurma/MyanmarCabo VerdeCambodiaCameroonCanadaCaribbeanCentral AmericaChileChinaColombiaCongoCosta RicaCroatiaCubaCzechoslovakiaDenmarkDominicaDominican RepublicEastern AfricaEastern AsiaEastern EuropeEcuadorEgyptEl SalvadorEnglandEritreaEthiopiaEuropeFijiFranceGermanyGhanaGreeceGrenadaGuatemalaGuyanaHaitiHondurasHong KongHungaryIndiaIndonesiaIranIraqIrelandIsraelItalyJamaicaJapanJordanKazakhstanKenyaKoreaKuwaitLaosLatin AmericaLatviaLebanonLiberiaLithuaniaMalaysiaMexicoMicronesiaMiddle AfricaMoldovaMoroccoNepalNetherlandsNicaraguaNigeriaNorth AmericaNorth MacedoniaNorthern AfricaNorthern EuropeNorwayOceaniaPakistanPanamaPeruPhilippinesPolandPortugalRomaniaRussiaSaudi ArabiaScotlandSenegalSerbiaSierra LeoneSingaporeSomaliaSouth AfricaSouth AmericaSouth Central AsiaSouth Eastern AsiaSouthern EuropeSpainSri LankaSt. Vincent and the GrenadinesSudanSwedenSwitzerlandSyriaTaiwanThailandTrinidad and TobagoTurkeyUgandaUkraineUruguayUzbekistanVenezuelaVietnamWest IndiesWestern AfricaWestern AsiaWestern EuropeYemenZaireZimbabweAzores
Ethiopian
Race
Ancestry
AfghanAfricanAlaska NativeAlaskan AthabascanAlbanianAleutAlsatianAmericanApacheArabArapahoArgentineanArmenianAssyrian/Chaldean/SyriacAustralianAustrianBahamianBangladeshiBarbadianBasqueBelgianBelizeanBermudanBhutaneseBlackfeetBolivianBrazilianBritishBritish West IndianBulgarianBurmeseCajunCambodianCanadianCape VerdeanCarpatho RusynCelticCentral AmericanCentral American IndianCherokeeCheyenneChickasawChileanChineseChippewaChoctawColombianColvilleComancheCosta RicanCreeCreekCroatianCrowCubanCypriotCzechCzechoslovakianDanishDelawareDominicanDutchDutch West IndianEastern EuropeanEcuadorianEgyptianEnglishEstonianEthiopianEuropeanFijianFilipinoFinnishFrenchFrench American IndianFrench CanadianGermanGerman RussianGhanaianGreekGuamanian/ChamorroGuatemalanGuyaneseHaitianHmongHonduranHopiHoumaHungarianIcelanderIndian (Asian)IndonesianInupiatIranianIraqiIrishIroquoisIsraeliItalianJamaicanJapaneseJordanianKenyanKiowaKoreanLaotianLatvianLebaneseLiberianLithuanianLumbeeLuxembourgerMacedonianMalaysianMalteseMarshalleseMenomineeMexicanMexican American IndianMongolianMoroccanNative HawaiianNavajoNepaleseNew ZealanderNicaraguanNigerianNorthern EuropeanNorwegianOkinawanOsageOttawaPaiutePakistaniPalestinianPanamanianParaguayanPennsylvania GermanPeruvianPimaPolishPortuguesePotawatomiPuebloPuerto RicanPuget Sound SalishRomanianRussianSalvadoranSamoanScandinavianScotch-IrishScottishSeminoleSenegaleseSerbianShoshoneSierra LeoneanSiouxSlavicSlovakSloveneSomaliSouth AfricanSouth AmericanSouth American IndianSoviet UnionSpaniardSpanishSpanish AmericanSpanish American IndianSri LankanSubsaharan AfricanSudaneseSwedishSwissSyrianTaiwaneseThaiTlingit-HaidaTohono O'OdhamTonganTrinidadian and TobagonianTsimshianTurkishU.S. Virgin IslanderUgandanUkrainianUruguayanUteVenezuelanVietnameseWelshWest IndianYakamaYaquiYugoslavianYumanYup'ikZimbabwean
Immigration
NonimmigrantsImmigrantsAfghanistanAfricaAlbaniaArgentinaArmeniaAsiaAustraliaAustriaBahamasBangladeshBarbadosBelarusBelgiumBelizeBoliviaBosnia and HerzegovinaBrazilBulgariaBurma/MyanmarCabo VerdeCambodiaCameroonCanadaCaribbeanCentral AmericaChileChinaColombiaCongoCosta RicaCroatiaCubaCzechoslovakiaDenmarkDominicaDominican RepublicEastern AfricaEastern AsiaEastern EuropeEcuadorEgyptEl SalvadorEnglandEritreaEthiopiaEuropeFijiFranceGermanyGhanaGreeceGrenadaGuatemalaGuyanaHaitiHondurasHong KongHungaryIndiaIndonesiaIranIraqIrelandIsraelItalyJamaicaJapanJordanKazakhstanKenyaKoreaLaosLatin AmericaLatviaLebanonLiberiaLithuaniaMalaysiaMexicoMicronesiaMiddle AfricaMoldovaMoroccoNepalNetherlandsNicaraguaNigeriaNorth AmericaNorth MacedoniaNorthern AfricaNorthern EuropeNorwayOceaniaPakistanPanamaPeruPhilippinesPolandPortugalRomaniaRussiaSaudi ArabiaScotlandSenegalSerbiaSierra LeoneSingaporeSomaliaSouth AfricaSouth AmericaSouth Central AsiaSouth Eastern AsiaSouthern EuropeSpainSri LankaSt. Vincent and the GrenadinesSudanSwedenSwitzerlandSyriaTaiwanThailandTrinidad and TobagoTurkeyUgandaUkraineUruguayUzbekistanVenezuelaVietnamWest IndiesWestern AfricaWestern AsiaWestern EuropeYemenZaireZimbabweAzores
GED/Equivalency
Income
Poverty
Unemployment
Labor Participation
Family Structure
Vehicle Availability
Education Level
Disability

GED/Equivalency Comparison

Immigrants from Kuwait

Ethiopians

Exceptional
Good
87.7%
GED/EQUIVALENCY
98.8/ 100
METRIC RATING
74th/ 347
METRIC RANK
86.0%
GED/EQUIVALENCY
63.7/ 100
METRIC RATING
167th/ 347
METRIC RANK

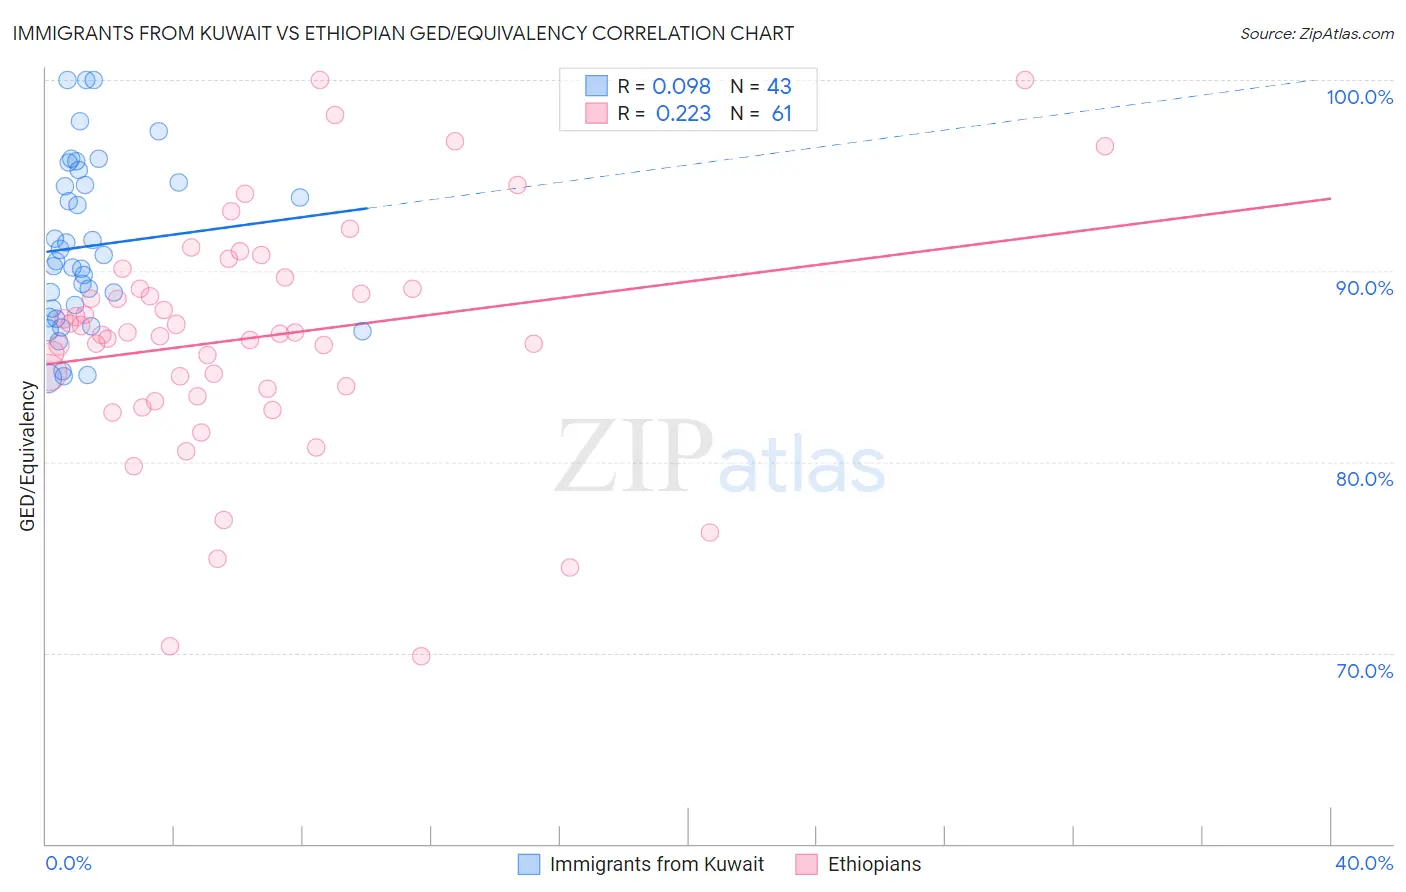
Immigrants from Kuwait vs Ethiopian GED/Equivalency Correlation Chart

The statistical analysis conducted on geographies consisting of 136,917,085 people shows a slight positive correlation between the proportion of Immigrants from Kuwait and percentage of population with at least ged/equivalency education in the United States with a correlation coefficient (R) of 0.098 and weighted average of 87.7%. Similarly, the statistical analysis conducted on geographies consisting of 223,262,051 people shows a weak positive correlation between the proportion of Ethiopians and percentage of population with at least ged/equivalency education in the United States with a correlation coefficient (R) of 0.223 and weighted average of 86.0%, a difference of 2.0%.
Immigrants from Kuwait vs Ethiopian GED/Equivalency

GED/Equivalency Correlation Summary

MeasurementImmigrants from KuwaitEthiopian
Minimum84.4%69.8%
Maximum100.0%100.0%
Range15.6%30.2%
Mean91.3%86.5%
Median90.5%86.7%
Interquartile 25% (IQ1)87.6%83.6%
Interquartile 75% (IQ3)94.6%89.4%
Interquartile Range (IQR)7.0%5.7%
Standard Deviation (Sample)4.4%6.2%
Standard Deviation (Population)4.3%6.1%

Similar Demographics by GED/Equivalency

Demographics Similar to Immigrants from Kuwait by GED/Equivalency

In terms of ged/equivalency, the demographic groups most similar to Immigrants from Kuwait are Belgian (87.7%, a difference of 0.020%), Scottish (87.7%, a difference of 0.020%), Ukrainian (87.7%, a difference of 0.030%), Austrian (87.7%, a difference of 0.030%), and Immigrants from Moldova (87.7%, a difference of 0.030%).
DemographicsRating | RankGED/Equivalency
British
99.1
/100
|
#67
Exceptional
87.8%
Immigrants | France
99.1
/100
|
#68
Exceptional
87.8%
Immigrants | Saudi Arabia
99.0
/100
|
#69
Exceptional
87.8%
Ukrainians
98.8
/100
|
#70
Exceptional
87.7%
Austrians
98.8
/100
|
#71
Exceptional
87.7%
Immigrants | Moldova
98.8
/100
|
#72
Exceptional
87.7%
Belgians
98.8
/100
|
#73
Exceptional
87.7%
Immigrants | Kuwait
98.8
/100
|
#74
Exceptional
87.7%
Scottish
98.7
/100
|
#75
Exceptional
87.7%
Immigrants | Serbia
98.7
/100
|
#76
Exceptional
87.7%
Slavs
98.7
/100
|
#77
Exceptional
87.7%
Irish
98.6
/100
|
#78
Exceptional
87.6%
English
98.6
/100
|
#79
Exceptional
87.6%
Immigrants | England
98.5
/100
|
#80
Exceptional
87.6%
Immigrants | Sri Lanka
98.3
/100
|
#81
Exceptional
87.5%

Demographics Similar to Ethiopians by GED/Equivalency

In terms of ged/equivalency, the demographic groups most similar to Ethiopians are Alsatian (86.0%, a difference of 0.010%), Immigrants from Albania (86.0%, a difference of 0.010%), Venezuelan (86.0%, a difference of 0.040%), Sierra Leonean (86.0%, a difference of 0.040%), and Immigrants from Ethiopia (86.0%, a difference of 0.050%).
DemographicsRating | RankGED/Equivalency
Immigrants | Morocco
69.5
/100
|
#160
Good
86.1%
Immigrants | Syria
69.3
/100
|
#161
Good
86.1%
Immigrants | Iraq
68.1
/100
|
#162
Good
86.1%
Ugandans
66.3
/100
|
#163
Good
86.1%
Venezuelans
65.5
/100
|
#164
Good
86.0%
Alsatians
64.3
/100
|
#165
Good
86.0%
Immigrants | Albania
64.2
/100
|
#166
Good
86.0%
Ethiopians
63.7
/100
|
#167
Good
86.0%
Sierra Leoneans
61.8
/100
|
#168
Good
86.0%
Immigrants | Ethiopia
61.2
/100
|
#169
Good
86.0%
Afghans
59.7
/100
|
#170
Average
85.9%
Immigrants | Chile
57.3
/100
|
#171
Average
85.9%
Bermudans
55.1
/100
|
#172
Average
85.8%
Immigrants | Venezuela
50.7
/100
|
#173
Average
85.8%
Ottawa
50.0
/100
|
#174
Average
85.8%