Colville Receiving Food Stamps

COMPARE

Colville
Race
Ancestry
AfghanAfricanAlaska NativeAlaskan AthabascanAlbanianAleutAlsatianAmericanApacheArabArapahoArgentineanArmenianAssyrian/Chaldean/SyriacAustralianAustrianBahamianBangladeshiBarbadianBasqueBelgianBelizeanBermudanBhutaneseBlackfeetBolivianBrazilianBritishBritish West IndianBulgarianBurmeseCajunCambodianCanadianCape VerdeanCarpatho RusynCelticCentral AmericanCentral American IndianCherokeeCheyenneChickasawChileanChineseChippewaChoctawColombianColvilleComancheCosta RicanCreeCreekCroatianCrowCubanCypriotCzechCzechoslovakianDanishDelawareDominicanDutchDutch West IndianEastern EuropeanEcuadorianEgyptianEnglishEstonianEthiopianEuropeanFijianFilipinoFinnishFrenchFrench American IndianFrench CanadianGermanGerman RussianGhanaianGreekGuamanian/ChamorroGuatemalanGuyaneseHaitianHmongHonduranHopiHoumaHungarianIcelanderIndian (Asian)IndonesianInupiatIranianIraqiIrishIroquoisIsraeliItalianJamaicanJapaneseJordanianKenyanKiowaKoreanLaotianLatvianLebaneseLiberianLithuanianLumbeeLuxembourgerMacedonianMalaysianMalteseMarshalleseMenomineeMexicanMexican American IndianMongolianMoroccanNative HawaiianNavajoNepaleseNew ZealanderNicaraguanNigerianNorthern EuropeanNorwegianOkinawanOsageOttawaPaiutePakistaniPalestinianPanamanianParaguayanPennsylvania GermanPeruvianPimaPolishPortuguesePotawatomiPuebloPuerto RicanPuget Sound SalishRomanianRussianSalvadoranSamoanScandinavianScotch-IrishScottishSeminoleSenegaleseSerbianShoshoneSierra LeoneanSiouxSlavicSlovakSloveneSomaliSouth AfricanSouth AmericanSouth American IndianSoviet UnionSpaniardSpanishSpanish AmericanSpanish American IndianSri LankanSubsaharan AfricanSudaneseSwedishSwissSyrianTaiwaneseThaiTlingit-HaidaTohono O'OdhamTonganTrinidadian and TobagonianTsimshianTurkishU.S. Virgin IslanderUgandanUkrainianUruguayanUteVenezuelanVietnameseWelshWest IndianYakamaYaquiYugoslavianYumanYup'ikZimbabwean
Immigration
NonimmigrantsImmigrantsAfghanistanAfricaAlbaniaArgentinaArmeniaAsiaAustraliaAustriaBahamasBangladeshBarbadosBelarusBelgiumBelizeBoliviaBosnia and HerzegovinaBrazilBulgariaBurma/MyanmarCabo VerdeCambodiaCameroonCanadaCaribbeanCentral AmericaChileChinaColombiaCongoCosta RicaCroatiaCubaCzechoslovakiaDenmarkDominicaDominican RepublicEastern AfricaEastern AsiaEastern EuropeEcuadorEgyptEl SalvadorEnglandEritreaEthiopiaEuropeFijiFranceGermanyGhanaGreeceGrenadaGuatemalaGuyanaHaitiHondurasHong KongHungaryIndiaIndonesiaIranIraqIrelandIsraelItalyJamaicaJapanJordanKazakhstanKenyaKoreaKuwaitLaosLatin AmericaLatviaLebanonLiberiaLithuaniaMalaysiaMexicoMicronesiaMiddle AfricaMoldovaMoroccoNepalNetherlandsNicaraguaNigeriaNorth AmericaNorth MacedoniaNorthern AfricaNorthern EuropeNorwayOceaniaPakistanPanamaPeruPhilippinesPolandPortugalRomaniaRussiaSaudi ArabiaScotlandSenegalSerbiaSierra LeoneSingaporeSomaliaSouth AfricaSouth AmericaSouth Central AsiaSouth Eastern AsiaSouthern EuropeSpainSri LankaSt. Vincent and the GrenadinesSudanSwedenSwitzerlandSyriaTaiwanThailandTrinidad and TobagoTurkeyUgandaUkraineUruguayUzbekistanVenezuelaVietnamWest IndiesWestern AfricaWestern AsiaWestern EuropeYemenZaireZimbabweAzores
Select to Compare
Race
Ancestry
AfghanAfricanAlaska NativeAlaskan AthabascanAlbanianAleutAlsatianAmericanApacheArabArapahoArgentineanArmenianAssyrian/Chaldean/SyriacAustralianAustrianBahamianBangladeshiBarbadianBasqueBelgianBelizeanBermudanBhutaneseBlackfeetBolivianBrazilianBritishBritish West IndianBulgarianBurmeseCajunCambodianCanadianCape VerdeanCarpatho RusynCelticCentral AmericanCentral American IndianCherokeeCheyenneChickasawChileanChineseChippewaChoctawColombianComancheCosta RicanCreeCreekCroatianCrowCubanCypriotCzechCzechoslovakianDanishDelawareDominicanDutchDutch West IndianEastern EuropeanEcuadorianEgyptianEnglishEstonianEthiopianEuropeanFijianFilipinoFinnishFrenchFrench American IndianFrench CanadianGermanGerman RussianGhanaianGreekGuamanian/ChamorroGuatemalanGuyaneseHaitianHmongHonduranHopiHoumaHungarianIcelanderIndian (Asian)IndonesianInupiatIranianIraqiIrishIroquoisIsraeliItalianJamaicanJapaneseJordanianKenyanKiowaKoreanLaotianLatvianLebaneseLiberianLithuanianLumbeeLuxembourgerMacedonianMalaysianMalteseMarshalleseMenomineeMexicanMexican American IndianMongolianMoroccanNative HawaiianNavajoNepaleseNew ZealanderNicaraguanNigerianNorthern EuropeanNorwegianOkinawanOsageOttawaPaiutePakistaniPalestinianPanamanianParaguayanPennsylvania GermanPeruvianPimaPolishPortuguesePotawatomiPuebloPuerto RicanPuget Sound SalishRomanianRussianSalvadoranSamoanScandinavianScotch-IrishScottishSeminoleSenegaleseSerbianShoshoneSierra LeoneanSiouxSlavicSlovakSloveneSomaliSouth AfricanSouth AmericanSouth American IndianSoviet UnionSpaniardSpanishSpanish AmericanSpanish American IndianSri LankanSubsaharan AfricanSudaneseSwedishSwissSyrianTaiwaneseThaiTlingit-HaidaTohono O'OdhamTonganTrinidadian and TobagonianTsimshianTurkishU.S. Virgin IslanderUgandanUkrainianUruguayanUteVenezuelanVietnameseWelshWest IndianYakamaYaquiYugoslavianYumanYup'ikZimbabwean
Immigration
NonimmigrantsImmigrantsAfghanistanAfricaAlbaniaArgentinaArmeniaAsiaAustraliaAustriaBahamasBangladeshBarbadosBelarusBelgiumBelizeBoliviaBosnia and HerzegovinaBrazilBulgariaBurma/MyanmarCabo VerdeCambodiaCameroonCanadaCaribbeanCentral AmericaChileChinaColombiaCongoCosta RicaCroatiaCubaCzechoslovakiaDenmarkDominicaDominican RepublicEastern AfricaEastern AsiaEastern EuropeEcuadorEgyptEl SalvadorEnglandEritreaEthiopiaEuropeFijiFranceGermanyGhanaGreeceGrenadaGuatemalaGuyanaHaitiHondurasHong KongHungaryIndiaIndonesiaIranIraqIrelandIsraelItalyJamaicaJapanJordanKazakhstanKenyaKoreaKuwaitLaosLatin AmericaLatviaLebanonLiberiaLithuaniaMalaysiaMexicoMicronesiaMiddle AfricaMoldovaMoroccoNepalNetherlandsNicaraguaNigeriaNorth AmericaNorth MacedoniaNorthern AfricaNorthern EuropeNorwayOceaniaPakistanPanamaPeruPhilippinesPolandPortugalRomaniaRussiaSaudi ArabiaScotlandSenegalSerbiaSierra LeoneSingaporeSomaliaSouth AfricaSouth AmericaSouth Central AsiaSouth Eastern AsiaSouthern EuropeSpainSri LankaSt. Vincent and the GrenadinesSudanSwedenSwitzerlandSyriaTaiwanThailandTrinidad and TobagoTurkeyUgandaUkraineUruguayUzbekistanVenezuelaVietnamWest IndiesWestern AfricaWestern AsiaWestern EuropeYemenZaireZimbabweAzores
Receiving Food Stamps
Income
Poverty
Unemployment
Labor Participation
Family Structure
Vehicle Availability
Education Level
Disability

Colville Receiving Food Stamps
Tragic

18.3%
PUBLIC INCOME | FOOD STAMPS
0.0/ 100
METRIC RATING
328th/ 347
METRIC RANK

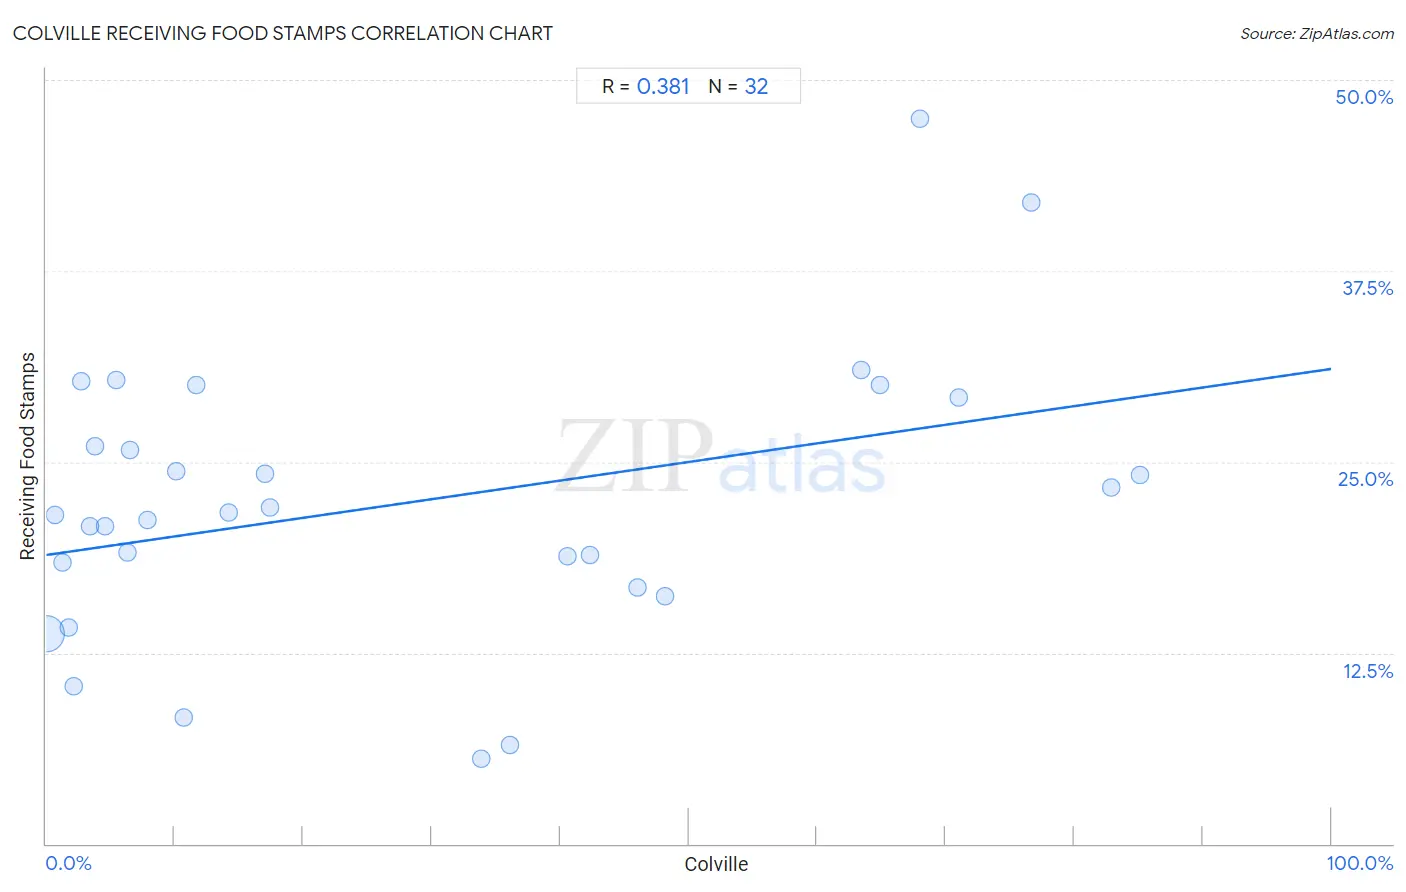
Colville Receiving Food Stamps Correlation Chart

The statistical analysis conducted on geographies consisting of 34,677,374 people shows a mild positive correlation between the proportion of Colville and percentage of population receiving government assistance and/or food stamps in the United States with a correlation coefficient (R) of 0.381 and weighted average of 18.3%. On average, for every 1% (one percent) increase in Colville within a typical geography, there is an increase of 0.12% in percentage of population receiving government assistance and/or food stamps.
Colville Receiving Food Stamps
It is essential to understand that the correlation between the percentage of Colville and percentage of population receiving government assistance and/or food stamps does not imply a direct cause-and-effect relationship. It remains uncertain whether the presence of Colville influences an upward or downward trend in the level of percentage of population receiving government assistance and/or food stamps within an area, or if Colville simply ended up residing in those areas with higher or lower levels of percentage of population receiving government assistance and/or food stamps due to other factors.

Demographics Similar to Colville by Receiving Food Stamps

In terms of receiving food stamps, the demographic groups most similar to Colville are Apache (18.3%, a difference of 0.21%), Immigrants from Dominica (18.4%, a difference of 0.46%), Cuban (18.2%, a difference of 0.52%), Immigrants from Haiti (18.2%, a difference of 0.63%), and British West Indian (17.9%, a difference of 2.4%).
DemographicsRating | RankReceiving Food Stamps
Natives/Alaskans
0.0
/100
|
#321
Tragic
17.3%
Immigrants from Grenada
0.0
/100
|
#322
Tragic
17.8%
Haitians
0.0
/100
|
#323
Tragic
17.8%
British West Indians
0.0
/100
|
#324
Tragic
17.9%
Immigrants from Haiti
0.0
/100
|
#325
Tragic
18.2%
Cubans
0.0
/100
|
#326
Tragic
18.2%
Apache
0.0
/100
|
#327
Tragic
18.3%
Colville
0.0
/100
|
#328
Tragic
18.3%
Immigrants from Dominica
0.0
/100
|
#329
Tragic
18.4%
Pima
0.0
/100
|
#330
Tragic
19.0%
Immigrants from Caribbean
0.0
/100
|
#331
Tragic
19.6%
Pueblo
0.0
/100
|
#332
Tragic
19.9%
Inupiat
0.0
/100
|
#333
Tragic
20.1%
Yuman
0.0
/100
|
#334
Tragic
20.2%
Immigrants from Cuba
0.0
/100
|
#335
Tragic
20.8%

Colville Receiving Food Stamps Correlation Summary

MeasurementColville DataReceiving Food Stamps Data
Minimum0.026%5.6%
Maximum85.1%47.5%
Range85.1%41.9%
Mean27.7%22.3%
Median12.9%21.6%
Interquartile 25% (IQ1)4.2%17.6%
Interquartile 75% (IQ3)47.1%27.6%
Interquartile Range (IQR)42.9%10.0%
Standard Deviation (Sample)28.4%9.1%
Standard Deviation (Population)28.0%8.9%

Correlation Details

Colville PercentileSample SizeReceiving Food Stamps
[
0.0%
-
0.5%
]
0.026%
34,435,16513.8%
[
0.5%
-
1.0%
]
0.65%
126,00721.5%
[
1.0%
-
1.5%
]
1.29%
34,95318.4%
[
1.5%
-
2.0%
]
1.70%
13,61914.2%
[
2.0%
-
2.5%
]
2.11%
17,95310.3%
[
2.5%
-
3.0%
]
2.75%
5,53530.3%
[
3.0%
-
3.5%
]
3.37%
5,40420.8%
[
3.5%
-
4.0%
]
3.83%
4,95726.0%
[
4.5%
-
5.0%
]
4.53%
5,03320.8%
[
5.0%
-
5.5%
]
5.44%
64330.4%
[
6.0%
-
6.5%
]
6.32%
91819.0%
[
6.5%
-
7.0%
]
6.56%
5,45625.8%
[
7.5%
-
8.0%
]
7.92%
1,09821.2%
[
10.0%
-
10.5%
]
10.15%
1,03424.4%
[
10.5%
-
11.0%
]
10.66%
1228.3%
[
11.5%
-
12.0%
]
11.68%
86530.0%
[
14.0%
-
14.5%
]
14.22%
9,21821.7%
[
16.5%
-
17.0%
]
16.99%
1,37724.2%
[
17.0%
-
17.5%
]
17.45%
42422.0%
[
33.5%
-
34.0%
]
33.81%
1,5385.6%
[
36.0%
-
36.5%
]
36.06%
1,3346.5%
[
40.5%
-
41.0%
]
40.54%
7418.8%
[
42.0%
-
42.5%
]
42.28%
39518.9%
[
46.0%
-
46.5%
]
46.01%
27616.8%
[
48.0%
-
48.5%
]
48.15%
27016.2%
[
63.0%
-
63.5%
]
63.38%
56831.0%
[
64.5%
-
65.0%
]
64.91%
1,10330.0%
[
67.5%
-
68.0%
]
67.97%
25647.5%
[
70.5%
-
71.0%
]
70.97%
15529.2%
[
76.5%
-
77.0%
]
76.66%
97742.0%
[
82.5%
-
83.0%
]
82.84%
33823.3%
[
85.0%
-
85.5%
]
85.11%
30924.1%