Colville College, 1 year or more

COMPARE

Colville
Race
Ancestry
AfghanAfricanAlaska NativeAlaskan AthabascanAlbanianAleutAlsatianAmericanApacheArabArapahoArgentineanArmenianAssyrian/Chaldean/SyriacAustralianAustrianBahamianBangladeshiBarbadianBasqueBelgianBelizeanBermudanBhutaneseBlackfeetBolivianBrazilianBritishBritish West IndianBulgarianBurmeseCajunCambodianCanadianCape VerdeanCarpatho RusynCelticCentral AmericanCentral American IndianCherokeeCheyenneChickasawChileanChineseChippewaChoctawColombianColvilleComancheCosta RicanCreeCreekCroatianCrowCubanCypriotCzechCzechoslovakianDanishDelawareDominicanDutchDutch West IndianEastern EuropeanEcuadorianEgyptianEnglishEstonianEthiopianEuropeanFijianFilipinoFinnishFrenchFrench American IndianFrench CanadianGermanGerman RussianGhanaianGreekGuamanian/ChamorroGuatemalanGuyaneseHaitianHmongHonduranHopiHoumaHungarianIcelanderIndian (Asian)IndonesianInupiatIranianIraqiIrishIroquoisIsraeliItalianJamaicanJapaneseJordanianKenyanKiowaKoreanLaotianLatvianLebaneseLiberianLithuanianLumbeeLuxembourgerMacedonianMalaysianMalteseMarshalleseMenomineeMexicanMexican American IndianMongolianMoroccanNative HawaiianNavajoNepaleseNew ZealanderNicaraguanNigerianNorthern EuropeanNorwegianOkinawanOsageOttawaPaiutePakistaniPalestinianPanamanianParaguayanPennsylvania GermanPeruvianPimaPolishPortuguesePotawatomiPuebloPuerto RicanPuget Sound SalishRomanianRussianSalvadoranSamoanScandinavianScotch-IrishScottishSeminoleSenegaleseSerbianShoshoneSierra LeoneanSiouxSlavicSlovakSloveneSomaliSouth AfricanSouth AmericanSouth American IndianSoviet UnionSpaniardSpanishSpanish AmericanSpanish American IndianSri LankanSubsaharan AfricanSudaneseSwedishSwissSyrianTaiwaneseThaiTlingit-HaidaTohono O'OdhamTonganTrinidadian and TobagonianTsimshianTurkishU.S. Virgin IslanderUgandanUkrainianUruguayanUteVenezuelanVietnameseWelshWest IndianYakamaYaquiYugoslavianYumanYup'ikZimbabwean
Immigration
NonimmigrantsImmigrantsAfghanistanAfricaAlbaniaArgentinaArmeniaAsiaAustraliaAustriaBahamasBangladeshBarbadosBelarusBelgiumBelizeBoliviaBosnia and HerzegovinaBrazilBulgariaBurma/MyanmarCabo VerdeCambodiaCameroonCanadaCaribbeanCentral AmericaChileChinaColombiaCongoCosta RicaCroatiaCubaCzechoslovakiaDenmarkDominicaDominican RepublicEastern AfricaEastern AsiaEastern EuropeEcuadorEgyptEl SalvadorEnglandEritreaEthiopiaEuropeFijiFranceGermanyGhanaGreeceGrenadaGuatemalaGuyanaHaitiHondurasHong KongHungaryIndiaIndonesiaIranIraqIrelandIsraelItalyJamaicaJapanJordanKazakhstanKenyaKoreaKuwaitLaosLatin AmericaLatviaLebanonLiberiaLithuaniaMalaysiaMexicoMicronesiaMiddle AfricaMoldovaMoroccoNepalNetherlandsNicaraguaNigeriaNorth AmericaNorth MacedoniaNorthern AfricaNorthern EuropeNorwayOceaniaPakistanPanamaPeruPhilippinesPolandPortugalRomaniaRussiaSaudi ArabiaScotlandSenegalSerbiaSierra LeoneSingaporeSomaliaSouth AfricaSouth AmericaSouth Central AsiaSouth Eastern AsiaSouthern EuropeSpainSri LankaSt. Vincent and the GrenadinesSudanSwedenSwitzerlandSyriaTaiwanThailandTrinidad and TobagoTurkeyUgandaUkraineUruguayUzbekistanVenezuelaVietnamWest IndiesWestern AfricaWestern AsiaWestern EuropeYemenZaireZimbabweAzores
Select to Compare
Race
Ancestry
AfghanAfricanAlaska NativeAlaskan AthabascanAlbanianAleutAlsatianAmericanApacheArabArapahoArgentineanArmenianAssyrian/Chaldean/SyriacAustralianAustrianBahamianBangladeshiBarbadianBasqueBelgianBelizeanBermudanBhutaneseBlackfeetBolivianBrazilianBritishBritish West IndianBulgarianBurmeseCajunCambodianCanadianCape VerdeanCarpatho RusynCelticCentral AmericanCentral American IndianCherokeeCheyenneChickasawChileanChineseChippewaChoctawColombianComancheCosta RicanCreeCreekCroatianCrowCubanCypriotCzechCzechoslovakianDanishDelawareDominicanDutchDutch West IndianEastern EuropeanEcuadorianEgyptianEnglishEstonianEthiopianEuropeanFijianFilipinoFinnishFrenchFrench American IndianFrench CanadianGermanGerman RussianGhanaianGreekGuamanian/ChamorroGuatemalanGuyaneseHaitianHmongHonduranHopiHoumaHungarianIcelanderIndian (Asian)IndonesianInupiatIranianIraqiIrishIroquoisIsraeliItalianJamaicanJapaneseJordanianKenyanKiowaKoreanLaotianLatvianLebaneseLiberianLithuanianLumbeeLuxembourgerMacedonianMalaysianMalteseMarshalleseMenomineeMexicanMexican American IndianMongolianMoroccanNative HawaiianNavajoNepaleseNew ZealanderNicaraguanNigerianNorthern EuropeanNorwegianOkinawanOsageOttawaPaiutePakistaniPalestinianPanamanianParaguayanPennsylvania GermanPeruvianPimaPolishPortuguesePotawatomiPuebloPuerto RicanPuget Sound SalishRomanianRussianSalvadoranSamoanScandinavianScotch-IrishScottishSeminoleSenegaleseSerbianShoshoneSierra LeoneanSiouxSlavicSlovakSloveneSomaliSouth AfricanSouth AmericanSouth American IndianSoviet UnionSpaniardSpanishSpanish AmericanSpanish American IndianSri LankanSubsaharan AfricanSudaneseSwedishSwissSyrianTaiwaneseThaiTlingit-HaidaTohono O'OdhamTonganTrinidadian and TobagonianTsimshianTurkishU.S. Virgin IslanderUgandanUkrainianUruguayanUteVenezuelanVietnameseWelshWest IndianYakamaYaquiYugoslavianYumanYup'ikZimbabwean
Immigration
NonimmigrantsImmigrantsAfghanistanAfricaAlbaniaArgentinaArmeniaAsiaAustraliaAustriaBahamasBangladeshBarbadosBelarusBelgiumBelizeBoliviaBosnia and HerzegovinaBrazilBulgariaBurma/MyanmarCabo VerdeCambodiaCameroonCanadaCaribbeanCentral AmericaChileChinaColombiaCongoCosta RicaCroatiaCubaCzechoslovakiaDenmarkDominicaDominican RepublicEastern AfricaEastern AsiaEastern EuropeEcuadorEgyptEl SalvadorEnglandEritreaEthiopiaEuropeFijiFranceGermanyGhanaGreeceGrenadaGuatemalaGuyanaHaitiHondurasHong KongHungaryIndiaIndonesiaIranIraqIrelandIsraelItalyJamaicaJapanJordanKazakhstanKenyaKoreaKuwaitLaosLatin AmericaLatviaLebanonLiberiaLithuaniaMalaysiaMexicoMicronesiaMiddle AfricaMoldovaMoroccoNepalNetherlandsNicaraguaNigeriaNorth AmericaNorth MacedoniaNorthern AfricaNorthern EuropeNorwayOceaniaPakistanPanamaPeruPhilippinesPolandPortugalRomaniaRussiaSaudi ArabiaScotlandSenegalSerbiaSierra LeoneSingaporeSomaliaSouth AfricaSouth AmericaSouth Central AsiaSouth Eastern AsiaSouthern EuropeSpainSri LankaSt. Vincent and the GrenadinesSudanSwedenSwitzerlandSyriaTaiwanThailandTrinidad and TobagoTurkeyUgandaUkraineUruguayUzbekistanVenezuelaVietnamWest IndiesWestern AfricaWestern AsiaWestern EuropeYemenZaireZimbabweAzores
College, 1 year or more
Income
Poverty
Unemployment
Labor Participation
Family Structure
Vehicle Availability
Education Level
Disability

Colville College, 1 year or more
Tragic

54.1%
COLLEGE, 1 YEAR OR MORE
0.1/ 100
METRIC RATING
281st/ 347
METRIC RANK

Colville College, 1 year or more Correlation Chart

The statistical analysis conducted on geographies consisting of 34,687,707 people shows a slight positive correlation between the proportion of Colville and percentage of population with at least college, 1 year or more education in the United States with a correlation coefficient (R) of 0.078 and weighted average of 54.1%. On average, for every 1% (one percent) increase in Colville within a typical geography, there is an increase of 0.036% in percentage of population with at least college, 1 year or more education.
Colville College, 1 year or more
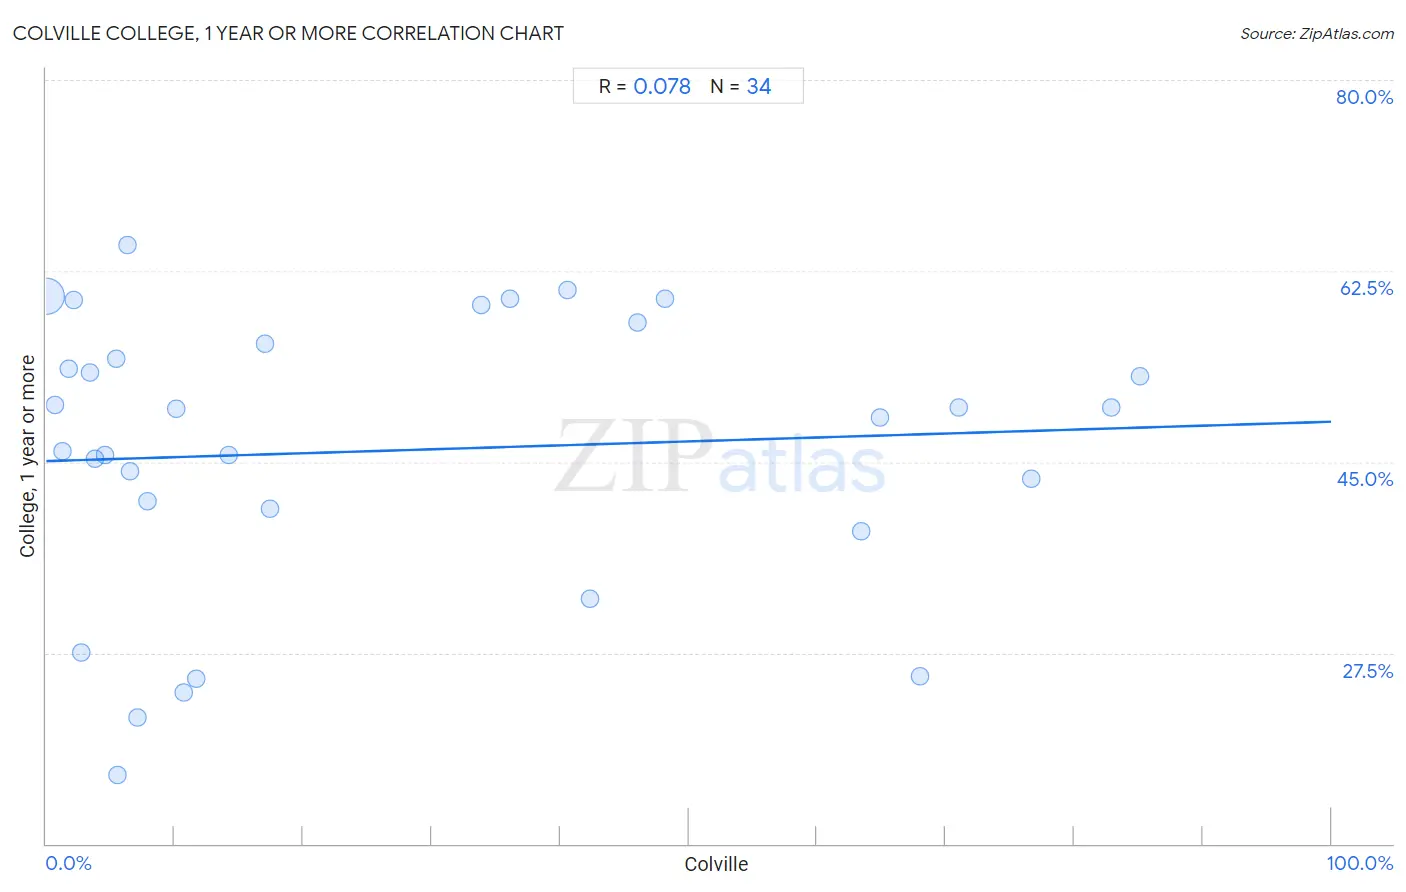
It is essential to understand that the correlation between the percentage of Colville and percentage of population with at least college, 1 year or more education does not imply a direct cause-and-effect relationship. It remains uncertain whether the presence of Colville influences an upward or downward trend in the level of percentage of population with at least college, 1 year or more education within an area, or if Colville simply ended up residing in those areas with higher or lower levels of percentage of population with at least college, 1 year or more education due to other factors.

Demographics Similar to Colville by College, 1 year or more

In terms of college, 1 year or more, the demographic groups most similar to Colville are Cheyenne (54.1%, a difference of 0.010%), Guyanese (54.1%, a difference of 0.040%), Arapaho (54.1%, a difference of 0.070%), Immigrants from Jamaica (54.2%, a difference of 0.090%), and Nicaraguan (53.9%, a difference of 0.40%).
DemographicsRating | RankCollege, 1 year or more
Belizeans
0.2
/100
|
#274
Tragic
54.4%
Americans
0.2
/100
|
#275
Tragic
54.4%
Shoshone
0.2
/100
|
#276
Tragic
54.3%
Ecuadorians
0.2
/100
|
#277
Tragic
54.3%
Immigrants from Jamaica
0.1
/100
|
#278
Tragic
54.2%
Arapaho
0.1
/100
|
#279
Tragic
54.1%
Cheyenne
0.1
/100
|
#280
Tragic
54.1%
Colville
0.1
/100
|
#281
Tragic
54.1%
Guyanese
0.1
/100
|
#282
Tragic
54.1%
Nicaraguans
0.1
/100
|
#283
Tragic
53.9%
Ute
0.1
/100
|
#284
Tragic
53.8%
Immigrants from Guyana
0.1
/100
|
#285
Tragic
53.5%
Central American Indians
0.1
/100
|
#286
Tragic
53.5%
Immigrants from Belize
0.1
/100
|
#287
Tragic
53.5%
Alaska Natives
0.0
/100
|
#288
Tragic
53.4%

Colville College, 1 year or more Correlation Summary

MeasurementColville DataCollege, 1 year or more Data
Minimum0.026%16.3%
Maximum85.1%64.9%
Range85.1%48.6%
Mean26.4%46.0%
Median11.2%49.4%
Interquartile 25% (IQ1)4.5%40.7%
Interquartile 75% (IQ3)46.0%55.8%
Interquartile Range (IQR)41.5%15.1%
Standard Deviation (Sample)28.0%13.0%
Standard Deviation (Population)27.6%12.8%

Correlation Details

Colville PercentileSample SizeCollege, 1 year or more
[
0.0%
-
0.5%
]
0.026%
34,437,79660.1%
[
0.5%
-
1.0%
]
0.65%
131,24450.2%
[
1.0%
-
1.5%
]
1.28%
35,84446.0%
[
1.5%
-
2.0%
]
1.70%
13,61953.6%
[
2.0%
-
2.5%
]
2.11%
17,95359.9%
[
2.5%
-
3.0%
]
2.74%
5,86727.5%
[
3.0%
-
3.5%
]
3.37%
5,40453.2%
[
3.5%
-
4.0%
]
3.83%
4,95745.2%
[
4.5%
-
5.0%
]
4.55%
5,58745.6%
[
5.0%
-
5.5%
]
5.44%
64354.5%
[
5.5%
-
6.0%
]
5.53%
56116.3%
[
6.0%
-
6.5%
]
6.32%
91864.9%
[
6.5%
-
7.0%
]
6.56%
5,45644.1%
[
7.0%
-
7.5%
]
7.09%
12721.6%
[
7.5%
-
8.0%
]
7.92%
1,09841.4%
[
10.0%
-
10.5%
]
10.15%
1,03449.8%
[
10.5%
-
11.0%
]
10.66%
12223.8%
[
11.5%
-
12.0%
]
11.68%
86525.2%
[
14.0%
-
14.5%
]
14.22%
9,21845.7%
[
16.5%
-
17.0%
]
16.99%
1,37755.8%
[
17.0%
-
17.5%
]
17.45%
42440.7%
[
33.5%
-
34.0%
]
33.81%
1,53859.4%
[
36.0%
-
36.5%
]
36.06%
1,33459.9%
[
40.5%
-
41.0%
]
40.54%
7460.7%
[
42.0%
-
42.5%
]
42.28%
39532.5%
[
46.0%
-
46.5%
]
46.01%
27657.8%
[
48.0%
-
48.5%
]
48.15%
27060.0%
[
63.0%
-
63.5%
]
63.38%
56838.6%
[
64.5%
-
65.0%
]
64.91%
1,10349.1%
[
67.5%
-
68.0%
]
67.97%
25625.4%
[
70.5%
-
71.0%
]
70.97%
15550.0%
[
76.5%
-
77.0%
]
76.66%
97743.4%
[
82.5%
-
83.0%
]
82.84%
33850.0%
[
85.0%
-
85.5%
]
85.11%
30952.9%