Colville College, Under 1 year

COMPARE

Colville
Race
Ancestry
AfghanAfricanAlaska NativeAlaskan AthabascanAlbanianAleutAlsatianAmericanApacheArabArapahoArgentineanArmenianAssyrian/Chaldean/SyriacAustralianAustrianBahamianBangladeshiBarbadianBasqueBelgianBelizeanBermudanBhutaneseBlackfeetBolivianBrazilianBritishBritish West IndianBulgarianBurmeseCajunCambodianCanadianCape VerdeanCarpatho RusynCelticCentral AmericanCentral American IndianCherokeeCheyenneChickasawChileanChineseChippewaChoctawColombianColvilleComancheCosta RicanCreeCreekCroatianCrowCubanCypriotCzechCzechoslovakianDanishDelawareDominicanDutchDutch West IndianEastern EuropeanEcuadorianEgyptianEnglishEstonianEthiopianEuropeanFijianFilipinoFinnishFrenchFrench American IndianFrench CanadianGermanGerman RussianGhanaianGreekGuamanian/ChamorroGuatemalanGuyaneseHaitianHmongHonduranHopiHoumaHungarianIcelanderIndian (Asian)IndonesianInupiatIranianIraqiIrishIroquoisIsraeliItalianJamaicanJapaneseJordanianKenyanKiowaKoreanLaotianLatvianLebaneseLiberianLithuanianLumbeeLuxembourgerMacedonianMalaysianMalteseMarshalleseMenomineeMexicanMexican American IndianMongolianMoroccanNative HawaiianNavajoNepaleseNew ZealanderNicaraguanNigerianNorthern EuropeanNorwegianOkinawanOsageOttawaPaiutePakistaniPalestinianPanamanianParaguayanPennsylvania GermanPeruvianPimaPolishPortuguesePotawatomiPuebloPuerto RicanPuget Sound SalishRomanianRussianSalvadoranSamoanScandinavianScotch-IrishScottishSeminoleSenegaleseSerbianShoshoneSierra LeoneanSiouxSlavicSlovakSloveneSomaliSouth AfricanSouth AmericanSouth American IndianSoviet UnionSpaniardSpanishSpanish AmericanSpanish American IndianSri LankanSubsaharan AfricanSudaneseSwedishSwissSyrianTaiwaneseThaiTlingit-HaidaTohono O'OdhamTonganTrinidadian and TobagonianTsimshianTurkishU.S. Virgin IslanderUgandanUkrainianUruguayanUteVenezuelanVietnameseWelshWest IndianYakamaYaquiYugoslavianYumanYup'ikZimbabwean
Immigration
NonimmigrantsImmigrantsAfghanistanAfricaAlbaniaArgentinaArmeniaAsiaAustraliaAustriaBahamasBangladeshBarbadosBelarusBelgiumBelizeBoliviaBosnia and HerzegovinaBrazilBulgariaBurma/MyanmarCabo VerdeCambodiaCameroonCanadaCaribbeanCentral AmericaChileChinaColombiaCongoCosta RicaCroatiaCubaCzechoslovakiaDenmarkDominicaDominican RepublicEastern AfricaEastern AsiaEastern EuropeEcuadorEgyptEl SalvadorEnglandEritreaEthiopiaEuropeFijiFranceGermanyGhanaGreeceGrenadaGuatemalaGuyanaHaitiHondurasHong KongHungaryIndiaIndonesiaIranIraqIrelandIsraelItalyJamaicaJapanJordanKazakhstanKenyaKoreaKuwaitLaosLatin AmericaLatviaLebanonLiberiaLithuaniaMalaysiaMexicoMicronesiaMiddle AfricaMoldovaMoroccoNepalNetherlandsNicaraguaNigeriaNorth AmericaNorth MacedoniaNorthern AfricaNorthern EuropeNorwayOceaniaPakistanPanamaPeruPhilippinesPolandPortugalRomaniaRussiaSaudi ArabiaScotlandSenegalSerbiaSierra LeoneSingaporeSomaliaSouth AfricaSouth AmericaSouth Central AsiaSouth Eastern AsiaSouthern EuropeSpainSri LankaSt. Vincent and the GrenadinesSudanSwedenSwitzerlandSyriaTaiwanThailandTrinidad and TobagoTurkeyUgandaUkraineUruguayUzbekistanVenezuelaVietnamWest IndiesWestern AfricaWestern AsiaWestern EuropeYemenZaireZimbabweAzores
Select to Compare
Race
Ancestry
AfghanAfricanAlaska NativeAlaskan AthabascanAlbanianAleutAlsatianAmericanApacheArabArapahoArgentineanArmenianAssyrian/Chaldean/SyriacAustralianAustrianBahamianBangladeshiBarbadianBasqueBelgianBelizeanBermudanBhutaneseBlackfeetBolivianBrazilianBritishBritish West IndianBulgarianBurmeseCajunCambodianCanadianCape VerdeanCarpatho RusynCelticCentral AmericanCentral American IndianCherokeeCheyenneChickasawChileanChineseChippewaChoctawColombianComancheCosta RicanCreeCreekCroatianCrowCubanCypriotCzechCzechoslovakianDanishDelawareDominicanDutchDutch West IndianEastern EuropeanEcuadorianEgyptianEnglishEstonianEthiopianEuropeanFijianFilipinoFinnishFrenchFrench American IndianFrench CanadianGermanGerman RussianGhanaianGreekGuamanian/ChamorroGuatemalanGuyaneseHaitianHmongHonduranHopiHoumaHungarianIcelanderIndian (Asian)IndonesianInupiatIranianIraqiIrishIroquoisIsraeliItalianJamaicanJapaneseJordanianKenyanKiowaKoreanLaotianLatvianLebaneseLiberianLithuanianLumbeeLuxembourgerMacedonianMalaysianMalteseMarshalleseMenomineeMexicanMexican American IndianMongolianMoroccanNative HawaiianNavajoNepaleseNew ZealanderNicaraguanNigerianNorthern EuropeanNorwegianOkinawanOsageOttawaPaiutePakistaniPalestinianPanamanianParaguayanPennsylvania GermanPeruvianPimaPolishPortuguesePotawatomiPuebloPuerto RicanPuget Sound SalishRomanianRussianSalvadoranSamoanScandinavianScotch-IrishScottishSeminoleSenegaleseSerbianShoshoneSierra LeoneanSiouxSlavicSlovakSloveneSomaliSouth AfricanSouth AmericanSouth American IndianSoviet UnionSpaniardSpanishSpanish AmericanSpanish American IndianSri LankanSubsaharan AfricanSudaneseSwedishSwissSyrianTaiwaneseThaiTlingit-HaidaTohono O'OdhamTonganTrinidadian and TobagonianTsimshianTurkishU.S. Virgin IslanderUgandanUkrainianUruguayanUteVenezuelanVietnameseWelshWest IndianYakamaYaquiYugoslavianYumanYup'ikZimbabwean
Immigration
NonimmigrantsImmigrantsAfghanistanAfricaAlbaniaArgentinaArmeniaAsiaAustraliaAustriaBahamasBangladeshBarbadosBelarusBelgiumBelizeBoliviaBosnia and HerzegovinaBrazilBulgariaBurma/MyanmarCabo VerdeCambodiaCameroonCanadaCaribbeanCentral AmericaChileChinaColombiaCongoCosta RicaCroatiaCubaCzechoslovakiaDenmarkDominicaDominican RepublicEastern AfricaEastern AsiaEastern EuropeEcuadorEgyptEl SalvadorEnglandEritreaEthiopiaEuropeFijiFranceGermanyGhanaGreeceGrenadaGuatemalaGuyanaHaitiHondurasHong KongHungaryIndiaIndonesiaIranIraqIrelandIsraelItalyJamaicaJapanJordanKazakhstanKenyaKoreaKuwaitLaosLatin AmericaLatviaLebanonLiberiaLithuaniaMalaysiaMexicoMicronesiaMiddle AfricaMoldovaMoroccoNepalNetherlandsNicaraguaNigeriaNorth AmericaNorth MacedoniaNorthern AfricaNorthern EuropeNorwayOceaniaPakistanPanamaPeruPhilippinesPolandPortugalRomaniaRussiaSaudi ArabiaScotlandSenegalSerbiaSierra LeoneSingaporeSomaliaSouth AfricaSouth AmericaSouth Central AsiaSouth Eastern AsiaSouthern EuropeSpainSri LankaSt. Vincent and the GrenadinesSudanSwedenSwitzerlandSyriaTaiwanThailandTrinidad and TobagoTurkeyUgandaUkraineUruguayUzbekistanVenezuelaVietnamWest IndiesWestern AfricaWestern AsiaWestern EuropeYemenZaireZimbabweAzores
College, Under 1 year
Income
Poverty
Unemployment
Labor Participation
Family Structure
Vehicle Availability
Education Level
Disability

Colville College, Under 1 year
Tragic

62.1%
COLLEGE, UNDER 1 YEAR
1.0/ 100
METRIC RATING
244th/ 347
METRIC RANK

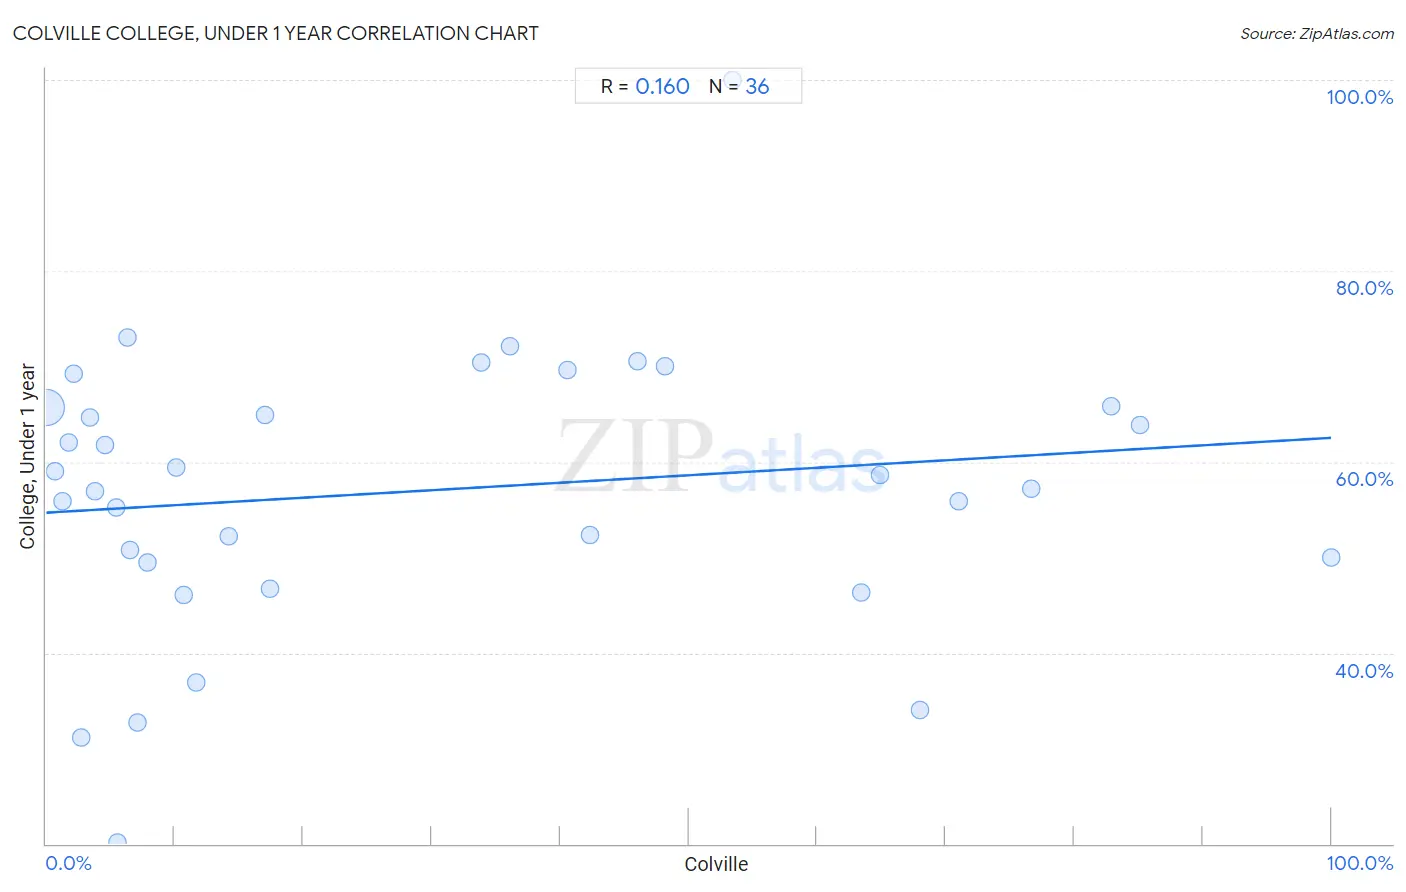
Colville College, Under 1 year Correlation Chart

The statistical analysis conducted on geographies consisting of 34,687,961 people shows a poor positive correlation between the proportion of Colville and percentage of population with at least college, under 1 year education in the United States with a correlation coefficient (R) of 0.160 and weighted average of 62.1%. On average, for every 1% (one percent) increase in Colville within a typical geography, there is an increase of 0.078% in percentage of population with at least college, under 1 year education.
Colville College, Under 1 year
It is essential to understand that the correlation between the percentage of Colville and percentage of population with at least college, under 1 year education does not imply a direct cause-and-effect relationship. It remains uncertain whether the presence of Colville influences an upward or downward trend in the level of percentage of population with at least college, under 1 year education within an area, or if Colville simply ended up residing in those areas with higher or lower levels of percentage of population with at least college, under 1 year education due to other factors.

Demographics Similar to Colville by College, Under 1 year

In terms of college, under 1 year, the demographic groups most similar to Colville are Delaware (62.1%, a difference of 0.060%), Hawaiian (62.1%, a difference of 0.090%), Malaysian (62.2%, a difference of 0.12%), Ottawa (62.2%, a difference of 0.17%), and Nepalese (62.2%, a difference of 0.18%).
DemographicsRating | RankCollege, Under 1 year
Immigrants from Burma/Myanmar
1.6
/100
|
#237
Tragic
62.5%
French American Indians
1.5
/100
|
#238
Tragic
62.4%
Nepalese
1.1
/100
|
#239
Tragic
62.2%
Aleuts
1.1
/100
|
#240
Tragic
62.2%
Ottawa
1.1
/100
|
#241
Tragic
62.2%
Malaysians
1.1
/100
|
#242
Tragic
62.2%
Hawaiians
1.1
/100
|
#243
Tragic
62.1%
Colville
1.0
/100
|
#244
Tragic
62.1%
Delaware
0.9
/100
|
#245
Tragic
62.1%
Marshallese
0.8
/100
|
#246
Tragic
61.9%
Immigrants from Liberia
0.8
/100
|
#247
Tragic
61.9%
Potawatomi
0.6
/100
|
#248
Tragic
61.8%
Vietnamese
0.5
/100
|
#249
Tragic
61.7%
Immigrants from Congo
0.5
/100
|
#250
Tragic
61.7%
Immigrants from Micronesia
0.5
/100
|
#251
Tragic
61.5%

Colville College, Under 1 year Correlation Summary

MeasurementColville DataCollege, Under 1 year Data
Minimum0.026%20.2%
Maximum100.0%100.0%
Range100.0%79.8%
Mean29.2%57.0%
Median12.9%57.9%
Interquartile 25% (IQ1)5.0%49.8%
Interquartile 75% (IQ3)50.8%65.7%
Interquartile Range (IQR)45.8%16.0%
Standard Deviation (Sample)30.1%14.8%
Standard Deviation (Population)29.7%14.6%

Correlation Details

Colville PercentileSample SizeCollege, Under 1 year
[
0.0%
-
0.5%
]
0.026%
34,437,79665.7%
[
0.5%
-
1.0%
]
0.65%
131,24459.0%
[
1.0%
-
1.5%
]
1.28%
35,84455.8%
[
1.5%
-
2.0%
]
1.70%
13,61962.1%
[
2.0%
-
2.5%
]
2.11%
17,95369.3%
[
2.5%
-
3.0%
]
2.74%
5,86731.2%
[
3.0%
-
3.5%
]
3.37%
5,40464.6%
[
3.5%
-
4.0%
]
3.83%
4,95757.0%
[
4.5%
-
5.0%
]
4.55%
5,58761.8%
[
5.0%
-
5.5%
]
5.44%
64355.3%
[
5.5%
-
6.0%
]
5.53%
56120.2%
[
6.0%
-
6.5%
]
6.32%
91873.0%
[
6.5%
-
7.0%
]
6.56%
5,45650.8%
[
7.0%
-
7.5%
]
7.09%
12732.8%
[
7.5%
-
8.0%
]
7.92%
1,09849.5%
[
10.0%
-
10.5%
]
10.15%
1,03459.4%
[
10.5%
-
11.0%
]
10.66%
12246.0%
[
11.5%
-
12.0%
]
11.68%
86536.9%
[
14.0%
-
14.5%
]
14.22%
9,21852.2%
[
16.5%
-
17.0%
]
16.99%
1,37765.0%
[
17.0%
-
17.5%
]
17.45%
42446.8%
[
33.5%
-
34.0%
]
33.81%
1,53870.4%
[
36.0%
-
36.5%
]
36.06%
1,33472.0%
[
40.5%
-
41.0%
]
40.54%
7469.6%
[
42.0%
-
42.5%
]
42.28%
39552.3%
[
46.0%
-
46.5%
]
46.01%
27670.5%
[
48.0%
-
48.5%
]
48.15%
27070.0%
[
53.0%
-
53.5%
]
53.39%
236100.0%
[
63.0%
-
63.5%
]
63.38%
56846.4%
[
64.5%
-
65.0%
]
64.91%
1,10358.6%
[
67.5%
-
68.0%
]
67.97%
25634.0%
[
70.5%
-
71.0%
]
70.97%
15555.8%
[
76.5%
-
77.0%
]
76.66%
97757.2%
[
82.5%
-
83.0%
]
82.84%
33865.8%
[
85.0%
-
85.5%
]
85.11%
30963.9%
[
99.5%
-
100.0%
]
100.00%
1850.0%